In my capstone class for future secondary math teachers, I ask my students to come up with ideas for engaging their students with different topics in the secondary mathematics curriculum. In other words, the point of the assignment was not to devise a full-blown lesson plan on this topic. Instead, I asked my students to think about three different ways of getting their students interested in the topic in the first place.
I plan to share some of the best of these ideas on this blog (after asking my students’ permission, of course).
This student submission comes from my former student DeForest Mitchell. His topic, from Precalculus: graphing sine and cosine functions.

C2: How has this topic appeared in high culture (art, classical music, theatre, etc.)?
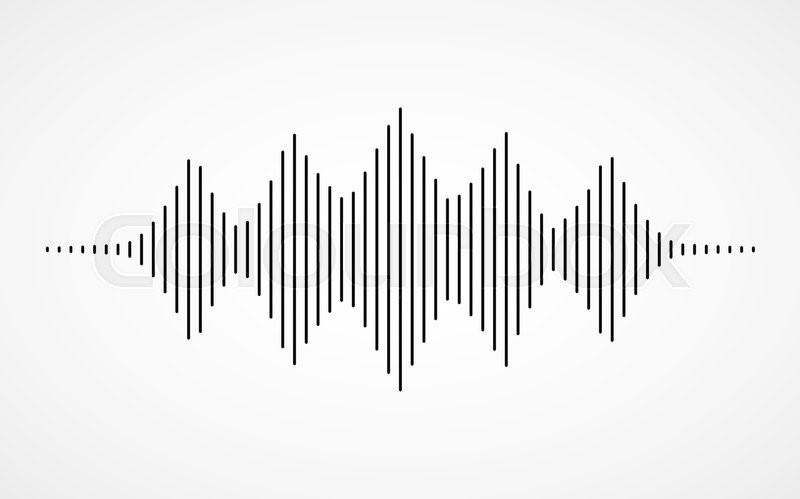
There are multiple forms of art and music and theater using sine and cosine. I am going to focus on music. Tone and sound in itself is a reverb of sine functions with different wavelengths and amplitude. This is such a great importance not only in knowing sine functions but also being able to create music. Knowing what a tone is and why the sound is becoming higher/lower or quieter/louder. If the amplitude is shorter then the sound itself will be quieter and vise versa with the amplitude growing so will the over all sound. If the period is increasing or becoming longer, the sound will be deeper, while shorter periods will create sharper and higher pitch sounds. Once you combine the amplitude and the period in specific ways that’s how specific notes and tones are made. As shown below, there is a combination of amplitudes and periods to create a sound wave using sine functions. With this in mind mathematically you can predict what a tone or song will sound like just depending on the inflection of amplitude and frequency of the function.

B1: How can this topic be used in your students’ future courses in mathematics or science?
One big component to my personal understanding of graphing sine and cosine is seeing a physical model of it. Such as a spring in physics, or the light spectrum. There are websites such as https://www.mathsisfun.com/algebra/trig-sin-cos-tan-graphs.html to be able to represent a sine function being sketched as a weighted spring bounces up and down. There are different slides to adjust the stiffness and dampening of the spring to show the alternate forms of the same graph. Since and cosine are used in many different forms of sciences, such as wavelengths (as shown in the picture below). This is a great way to show the students that there is a reason to learn the subject and that there are practical uses for it in life outside of school. For example, with the wavelength spectrum a teacher can make the correlation that a sine function with a longer period would be like soundwaves that have a longer wavelength, also to show that there are only certain wavelengths that we can see and there can be a correlation to graph the sine period and that if you were to make it into a function that there is only a certain few period lengths for a sine function for humans to be able to see colors.

D1: What interesting things can you say about the people who contributed to the discovery and/or the development of this topic? (You might want to consult Math Through The Ages.)
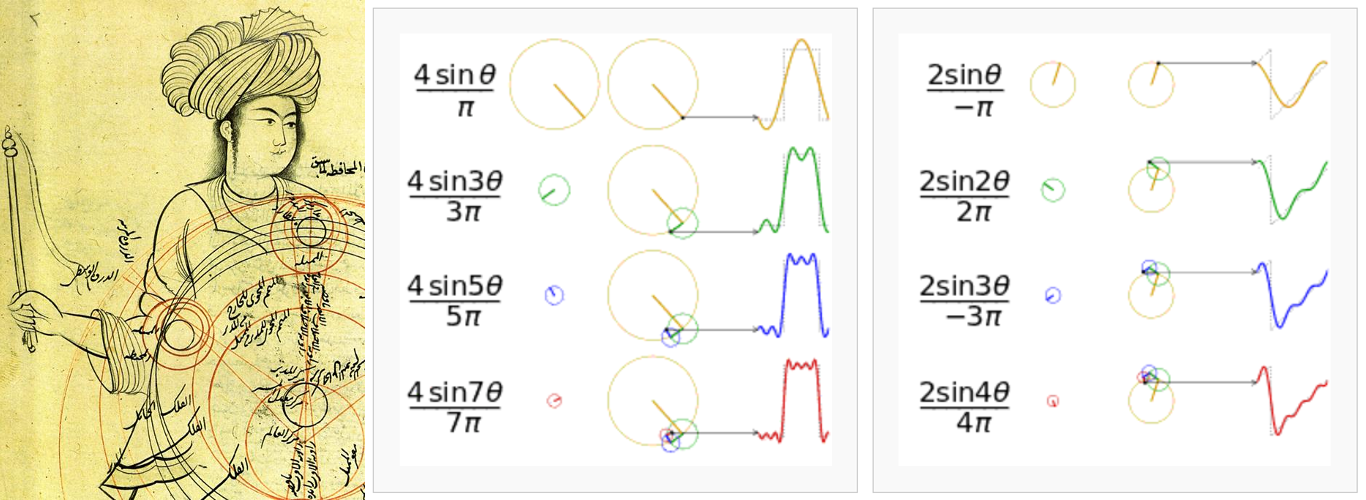
Circles have been around for millions of years and are to this day one of the simplest shapes. With Circles and by tracking the circumference of the circle you can make sine and cosine graphs. Joseph Fourier (1768 – 1830 A.D.) was a very influential person with the devilment of graphing sine and cosine functions. He was so due to his the foundning of the Fourier series. “Fourier series (thus the Fourier transform and finally the Discrete Fourier Transform) is our ancient desire to express everything in terms of circles or the most exceptionally simple and elegant abstract human construct. Most people prefer to say the same thing in a more ahistorical manner: to break a function into sines and cosines.” The summative way to say saying that Fourier came up with an equation to take any repeating series and be able to turn it into forms of sine and cosine to be able to graph. Which in turn creates a circle to better understand the said repeating series. This was a great mathematical find to show the correlation between any repeating series and the more well-known sine and cosine terms today. As shown below, with the Fourier series they were able to take a repeating series to “convert” them into a circle and then be able to graph the functions in terms of sine and cosine.
Resources:
https://www.gnu.org/software/gnuastro/manual/html_node/Fourier-series-historical-background.html

 and
and  . Consequently,
 ,
,
 is defined as
![\hbox{SD}(X) = \sqrt{E(X^2) - [E(X)]^2}](https://s0.wp.com/latex.php?latex=%5Chbox%7BSD%7D%28X%29+%3D+%5Csqrt%7BE%28X%5E2%29+-+%5BE%28X%29%5D%5E2%7D&bg=ffffff&fg=000000&s=0&c=20201002) .
. implies that
  must satisfy
 .
. , then
  for some constants
  and
and  , where
  . On the other hand, if
  , if
, if  .
.

 , and the substitution
  .
. .
. satisfies the horizontal line test. It turns out that the choice of domain has surprising consequences that are almost unforeseeable using only the tools of Precalculus.
 uses the interval
 ![[0,\pi]](https://s0.wp.com/latex.php?latex=%5B0%2C%5Cpi%5D&bg=ffffff&fg=000000&s=0&c=20201002) — or, more precisely,
— or, more precisely, ![[0,\pi/2) \cup (\pi/2, \pi]](https://s0.wp.com/latex.php?latex=%5B0%2C%5Cpi%2F2%29+%5Ccup+%28%5Cpi%2F2%2C+%5Cpi%5D&bg=ffffff&fg=000000&s=0&c=20201002) to avoid the vertical asymptote at
to avoid the vertical asymptote at  . This portion of the graph of
  . This is perhaps not surprising since, when both are defined,
  and
and  are reciprocals.
 matches that of
  , we have the convenient identity
 .
. .
. — that is, for
  — but it still works for
  and
and  .
. and
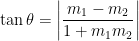
and  can be found using the formula
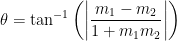 .
. and
and  axis.
axis.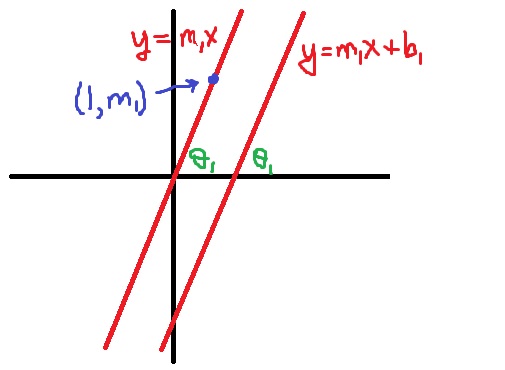
 is entirely superfluous to finding the angle
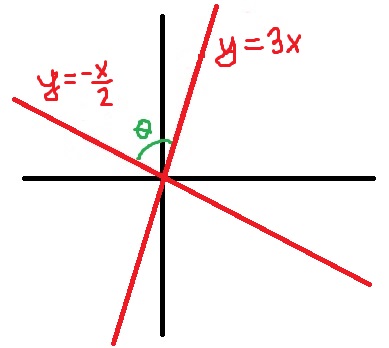
  . The important thing that matters is the slope of the line, not where the line intersects the
  axis.
axis. lies on the line
  can be found by dividing the
  .
.
 .
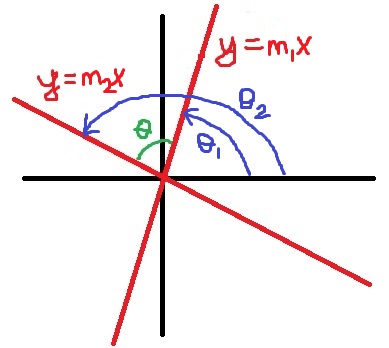
. will either be equal to
  or
or  , depending on the values of
  and
and  . Let’s now compute both
  and
and  using the formula for the difference of two angles:

 and
and  , the value of
  must be positive (or undefined if
  … for now, we’ll ignore this special case). Therefore, whichever of the above two lines holds, it must be that
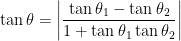
 and
and  :
:

 , and the right hand side is also undefined if
  . This matches the theorem that the two lines are perpendicular if and only if
  , or that the slopes of the two lines are negative reciprocals.
 and
and  .
.
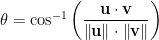
 and
and  . I use the caveat almost because the angle between two vectors could be between
  , while the smallest angle between two lines must lie between
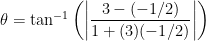


 .
. .
.