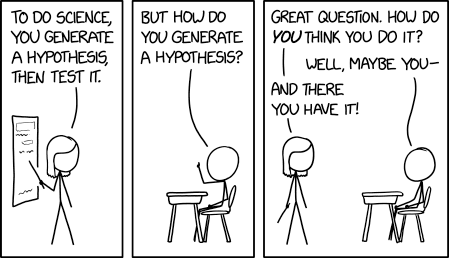
Constructing the Null and Alternate Hypotheses
Source: https://xkcd.com/2533/
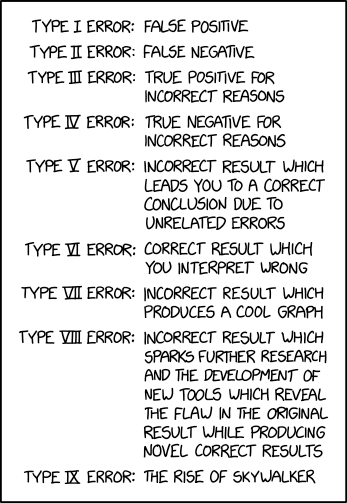
Source: https://xkcd.com/2303/
A brief explanation can be found at https://www.explainxkcd.com/wiki/index.php/2303:_Error_Types.
This awful pun is just in time for Valentine’s Day.

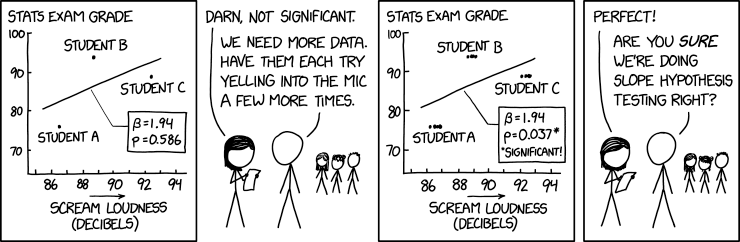
Source: https://www.facebook.com/NeuroNewsResearch/photos/a.479172065434890/2989385557746849/?type=3&theater
The following article was recommended to me by a former student: https://towardsdatascience.com/statistics-for-people-in-a-hurry-a9613c0ed0b. It’s synopsis is in the opening paragraph:
Ever wished someone would just tell you what the point of statistics is and what the jargon means in plain English? Let me try to grant that wish for you! I’ll zoom through all the biggest ideas in statistics in 8 minutes! Or just 1 minute, if you stick to the large font bits.
In this series, I’m compiling some of the quips and one-liners that I’ll use with my students to hopefully make my lessons more memorable for them.
Today’s quip is one that I’ll use in a statistics class when we find an extraordinarily small 
There is a social theory that states that people tend to postpone their deaths until after some meaningful event… birthdays, anniversaries, the World Series.
In 1978, social scientists investigated obituaries that appeared in a Salt Lake City newspaper. Among the 747 obituaries examined, 60 of the deaths occurred in the three-month period preceding their birth month. However, if the day of death is independent of birthday, we would expect that 25% of these deaths would occur in this three-month period.
Does this study provide statistically significant evidence to support this theory? Use
.
It turns out, using a one-tailed hypothesis test for proportions, that the test statistics is 


I’ll begin by asking, “Is the null hypothesis [that the proportion of deaths really is 25%] possible?” The correct answer is, “Yes, it’s possible.” Even extraordinarily small
After all, I found a woman who agreed to marry me. So extremely unlikely events are still possible.
Once the laughter dies down, I’ll ask the second question, “Is the null hypothesis plausible?” Of course, the answer is no, and so we reject the null hypothesis in favor of the alternative.
In this series, I’m compiling some of the quips and one-liners that I’ll use with my students to hopefully make my lessons more memorable for them.
Not everything in mathematics works out the way we’d prefer it to. For example, in statistics, a Type I error, whose probability is denoted by 

Ideally, we’d like 

There are actually two places in the country where this can happen. One’s in California, and the other is in Florida. And that place is called Fantasyland.
In this series, I’m compiling some of the quips and one-liners that I’ll use with my students to hopefully make my lessons more memorable for them.
Here are some sage words of wisdom that I give in my statistics class:
If the alternative hypothesis has the form
, then the rejection region lies to the right of
. On the other hand, if the alternative hypothesis has the form
, then the rejection region lies to the left of
On the other hand, if the alternative hypothesis has the form
, then the rejection region has two parts: one part to the left of
I recently had a flash of insight when teaching statistics. I have completed my lectures of finding confidence intervals and conducting hypothesis testing for one-sample problems (both for averages and for proportions), and I was about to start my lectures on two-sample problems (liek the difference of two means or the difference of two proportions).
On the one hand, this section of the course is considerably more complicated because the formulas are considerably longer and hence harder to remember (and more conducive to careless mistakes when using a calculator). The formula for the standard error is longer, and (in the case of small samples) the Welch-Satterthwaite formula is especially cumbersome to use.
On the other hand, students who have mastered statistical techniques for one sample can easily extend this knowledge to the two-sample case. The test statistic (either 

I hadn’t prepared this ahead of time, but while I was lecturing to my students I remembered a story that I heard a music professor say about students learning how to play percussion instruments. As opposed to other musicians, the budding percussionist only has a few basic techniques to learn and master. The trick for the percussionist is not memorizing hundreds of different techniques but correctly applying a few techniques to dozens of different kinds of instruments (drums, xylophones, bells, cymbals, etc.)
It hit me that this was an apt analogy for the student of statistics. Once the techniques of the one-sample case are learned, these same techniques are applied, with slight modifications, to the two-sample case.
I’ve been using this analogy ever since, and it seems to resonate (pun intended) with my students as they learn and practice the avalanche of formulas for two-sample statistics problems.
FiveThirtyEight.com published a very interesting feature: asking some leading scientists at a statistics conference to explain a P-value in simple, nontechnical terms. While they all knew the technical definition of a P-value, they were at a loss as to how to explain this technical notion to a nontechnical audience.
I plan on showing this article (and the embedded video) to my future statistics classes.
