Engaging students: Venn diagrams

In my capstone class for future secondary math teachers, I ask my students to come up with ideas for engaging their students with different topics in the secondary mathematics curriculum. In other words, the point of the assignment was not to devise a full-blown lesson plan on this topic. Instead, I asked my students to think about three different ways of getting their students interested in the topic in the first place.

I plan to share some of the best of these ideas on this blog (after asking my students’ permission, of course).

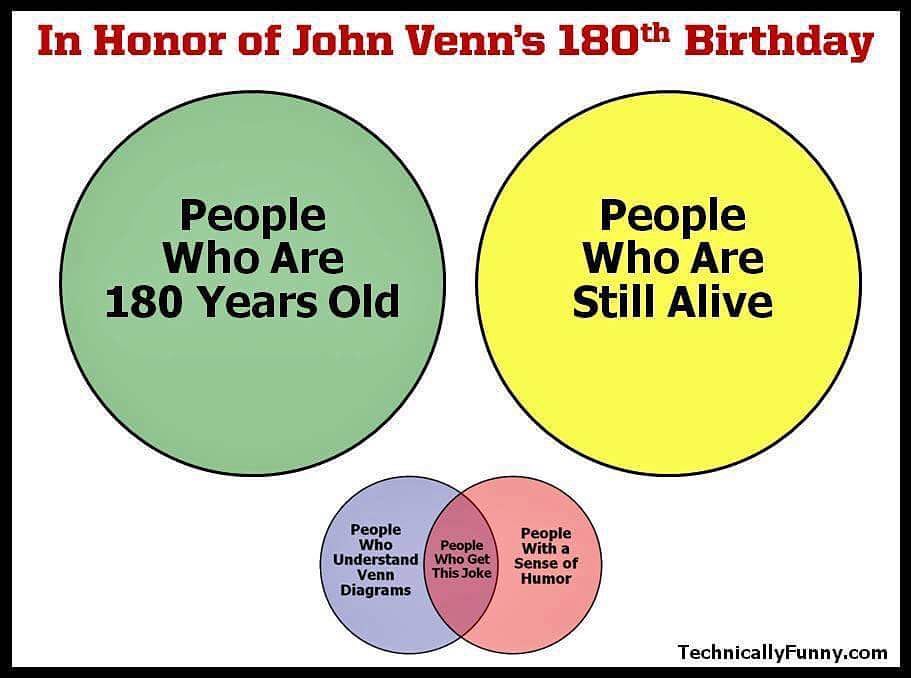
This student submission comes from my former student Amber Northcott. Her topic, from Probability: Venn diagrams.

green line

How could you as a teacher create an activity or project that involves your topic?

There are a few activities you can do with Venn diagrams. One idea is for the first day of class you can put up a big poster with a Venn diagram on it or you can draw one on the board. One circle can be ‘loves math’, while the other is ‘do not like math’. Then of course the center where the two circles intertwine will be the students who love math, but yet don’t like it. When your students come into the room you can have them put their name where it seems fit. This way you can get to better know your students on the topic of math. Another idea is that when you get to a topic, for instance arithmetic and geometric sequences, you can create a giant poster Venn diagram or draw it on the board. Then you can have your students write one thing that either arithmetic has or geometric has or both of them have. Once each student has put up just one thing on the Venn diagram, you can start a class discussion on the Venn diagram. While the discussion goes on you may fix a couple things here and there or even add to it. At the end each student will have their own Venn diagram to fil out, so they can have it in their notes.


green line

How can this topic be used in your students’ future courses in mathematics or science?


Venn diagrams are an easier way to compare and contrast two topics. It can help differentiate between the two topics. For example, how are geometric and arithmetic sequences different? Do they have anything in common? What do they have in common? This helps students identify the topics more thoroughly and helps them get a better understanding about each topic.


green line

How has this topic appeared in the news.


Not too long ago Hillary Clinton posted a Venn diagram about gun control on twitter. In response she was getting mocked and criticized. A short article on thehill.com goes into the mockery by showing pictures of people’s tweets to Hillary Clinton. Some had two circles separate from each other with one stating people who know how to make Venn diagrams and the other one stating Hillary’s graphic design staff. The other article from the Washington Post actually goes through her Venn diagram and fixes errors. These errors include the data in the Venn diagram.

Letting students see this, would definitely cause a discussion. I think we can turn the discussion into whether or not we think the Venn diagram was wrong. By having this discussion, we can learn more about what the students know about Venn diagrams and shed more light on how we can use the Venn diagrams in many different ways for many different topics.


References

https://www.washingtonpost.com/news/the-fix/wp/2016/05/20/we-fixed-hillary-clintons-terrible-venn-diagram-on-gun-control/

http://thehill.com/blogs/ballot-box/presidential-races/280706-clinton-mocked-for-misuse-of-venn-diagram


Lessons from teaching gifted elementary school students: Index (updated)

I’m doing something that I should have done a long time ago: collect past series of posts into a single, easy-to-reference post. The following posts formed my series on various lessons I’ve learned while trying to answer the questions posed by gifted elementary school students. (This is updated from my previous index.)

Part 1: A surprising pattern in some consecutive perfect squares.

Part 2: Calculating 2 to a very large exponent.

Part 3a: Calculating 2 to an even larger exponent.

Part 3b: An analysis of just how large this number actually is.

Part 4a: The chance of winning at BINGO in only four turns.

Part 4b: Pedagogical thoughts on one step of the calculation.

Part 4c: A complicated follow-up question.

Part 5a: Exponentiation is multiplication as multiplication is to addition. So, multiplication is to addition as addition is to what? (I offered the answer of incrementation, but it was rejected: addition requires two inputs, while incrementation only requires one.)

Part 5b: Why there is no binary operation that completes the above analogy.

Part 5c: Knuth’s up-arrow notation for writing very big numbers.

Part 5d: Graham’s number, reputed to be the largest number ever to appear in a mathematical proof.

Part 6a: Calculating $(255/256)^x$.

Part 6b: Solving $(255/256)^x = 1/2$ without a calculator.

Part 7a: Estimating the size of a 1000-pound hailstone.

Part 7b: Estimating the size a 1000-pound hailstone.

Part 8a: Statement of an usually triangle summing problem.

Part 8b: Solution using binomial coefficients.

Part 8c: Rearranging the series.

Part 8d: Reindexing to further rearrange the series.

Part 8e: Rewriting using binomial coefficients again.

Part 8f: Finally obtaining the numerical answer.

Part 8g: Extracting the square root of the answer by hand.

What I Learned from Reading “Gamma: Exploring Euler’s Constant” by Julian Havil: Part 7

Suppose that two positive integers are chosen at random. What is the probability that they are relatively prime (that is, have no common factors except 1)?

The answer is exactly what you’d expect it be (Gamma, p. 68): 6/\pi^2, or about 60.8%.

Yes, that was a joke.

Indeed, if k positive integers are random, the probability that they are relatively prime is 1/\zeta(k), where Riemann’s zeta function arises once again.

Even more, the probability that k random positive integers lack a nth power common divisor is 1/\zeta(nk).

I’ll refer the interested reader to Gamma and also to Mathworld (and references therein) for more details.


green line

When I researching for my series of posts on conditional convergence, especially examples related to the constant \gamma, the reference Gamma: Exploring Euler’s Constant by Julian Havil kept popping up. Finally, I decided to splurge for the book, expecting a decent popular account of this number. After all, I’m a professional mathematician, and I took a graduate level class in analytic number theory. In short, I don’t expect to learn a whole lot when reading a popular science book other than perhaps some new pedagogical insights.

Boy, was I wrong. As I turned every page, it seemed I hit a new factoid that I had not known before.

In this series, I’d like to compile some of my favorites — while giving the book a very high recommendation.

Tennis and best 2-out-of-3 vs. best 3-out-of-5

I recently read a very interesting article on FiveThirtyEight.com regarding men’s and women’s tennis that reminded me of the following standard problem in probability.

Player X and Player Y play a series of at most n games, and a winner is declared when either Player X or Player Y wins at least n/2 games. Suppose that the chance that Player X wins is p, and suppose that the outcomes of the games are independent. Find the probability that Player Y wins if (a) n = 3, (b) n = 5.

The easiest way to solve this is to assume that all n games are played, even if that doesn’t actually happen in real life. Then, for part (a), we can use the binomial distribution to find

  • P(X = 0) = P(Y = 3) = (1-p)^3
  • P(X = 1) = P(Y = 2) = 3p(1-p)^2
  • P(X = 2) = P(Y = 1) = 3p^2(1-p)
  • P(X = 3) = P(Y = 0) = p^3

Adding the first two probabilities, the chance that Player Y wins is (1-p)^3 + 3p(1-p)^2 = (1-p)^2 (1+2p).

Similarly, for part (b),

  • P(X = 0) = P(Y = 5) = (1-p)^5
  • P(X = 1) = P(Y = 4) = 5 p (1-p)^4
  • P(X = 2) = P(Y = 3) = 10p^2 (1-p)^3
  • P(X = 3) = P(Y = 2) = 10 p^3 (1-p)^2
  • P(X = 4) = P(Y = 1) = 5 p^4 (1-p)
  • P(X = 5) = P(Y = 0) = p^5

Adding the first three probabilities, the chance that Player Y wins is (1-p)^5 + 5p(1-p)^4 + 10p^2(1-p)^3 = (1-p)^3 (1+3p+6p^2).

The graphs of (1-p)^2 (1+2p) and (1-p)^3 (1+3p+6p^2) on the interval 0.7 \le p \le 0.9 are shown below in blue and orange, respectively. The lesson is clear: if p > 0.5, then clearly the chance that Player Y wins is less than 50%. However, Player Y’s chances of upsetting Player X are greater if they play a best 2-out-of-3 series instead of a best 3-out-of-5 series.
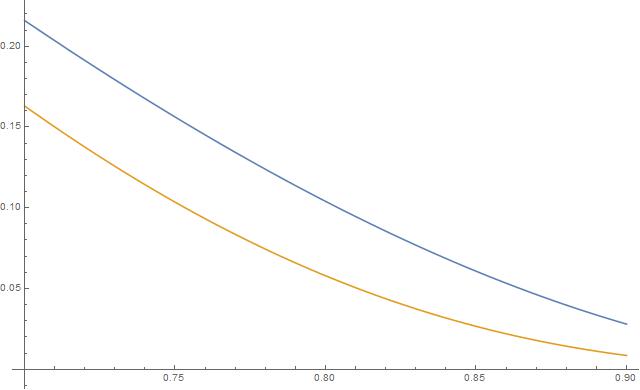
best2outof3Remarkably, this above curve has been observed in real-life sports: namely, women’s tennis (which plays best 2 sets out of 3 — marked WTA below) and men’s tennis (which plays best 3 sets out of 5 in Grand Slams — marked ATP below). The chart indicates that when two men’s players ranked 20 places apart play each other in Grand Slams, an upset occurs about 13% of the time. However, the upset percentage is only 5% in women’s tennis. (This approximately matches the above curve near p = 0.8.)

However, in tennis tournaments that are not Grand Slams, men’s tennis players also play a matches with a maximum of 3 sets. In those tournaments, the chances of an upset are approximately equal in both men’s tennis and women’s tennis.

However, since the casual tennis fan (like me) only tunes into the Grand Slams but not other tennis matches, this fact is not widely known — which gives the misleading impression that top women’s tennis players are not as tough, skilled, etc. as men’s tennis players.

The FiveThirtyEight article argues that top women’s tennis players don’t make it to the latter stages of Grand Slam tournaments than top men’s players because of the two tournaments are held under these different rules, and that women’s tennis would be better served if their matches were also played in a best-3-out-of-5 format.


Larger or smaller?

Suppose I write down two different numbers on two slips of paper. You have no idea what the two numbers are. They could be really large or really small, positive or negative, rational or irrational. All you know is that the two numbers are different.Your job is to pick the larger number.

Is there a way for you to guess the larger number with a probability greater than 50%?

The surprising answer is yes.

Engaging students: Expressing probability as a fraction and as a percentage

In my capstone class for future secondary math teachers, I ask my students to come up with ideas for engaging their students with different topics in the secondary mathematics curriculum. In other words, the point of the assignment was not to devise a full-blown lesson plan on this topic. Instead, I asked my students to think about three different ways of getting their students interested in the topic in the first place.

I plan to share some of the best of these ideas on this blog (after asking my students’ permission, of course).

This student submission again comes from my former student Zacquiri Rutledge. His topic, from probability: expressing a probability as a fraction and as a percentage.

green line

Probability involves any kind of situation where the outcomes are known, but are not 100% certain. Examples of this could be things as simple as flipping a coin, to trying to predict the next card while playing blackjack. However, for a student who is just beginning to understand probability, I thought a word problem involving the rolling of a die would be just challenging enough. “You and your best friend have been playing Monopoly for hours. After several times around the board, you own a large amount of the properties and your friend is nearly bankrupt. In fact, your friend does not have enough money to survive landing on your Boardwalk property in the corner of the board. In order for your friend to land on this space, he/she would need to roll a 12. First, calculate the odds that one die will roll a 6 and express it both as a fraction and as a percentage. Then, calculate the odds that both dice will roll a 6 and express it both as a fraction and as a percentage.”

green line

After learning the basics of probability as fractions and percentages, students can then begin to learn about how to change them into “odds”, or the probability of a series of actions. Since probability is simply the ratio between the desired number of outcomes and the total number of outcomes, only knowing how to write ratios will not help the student in calculating odds. By changing the probability ratio into a fraction, this will allow the student to easily apply the multiplication principle to a series of actions to find the larger probability ratio. From there the student will be able use previous experience of changing probability into a percentage to state how likely or unlikely a situation is.


green line

Probability is found in many areas of culture and science. However, one of the most widely known forms of probability is in gambling. People all over the world gamble for money, for fun, and sometimes even for sport. A few of the common games people play in casinos are Roulette, Blackjack, and Texas Hold’em. Each one of these games has its own way in which it uses probability to make it more difficult for a player to make money.

To play a game of Roulette, all a player has to do is bet on which number, color, or set of numbers they think might win. On the table are the numbers 00, 0, and 1 through 36. 00 and 0 are both their own color, but 1 through 36 alternate between red and black. After the player bets, the rest of the game is controlled by “The House” or the casino. A ball is placed on a rotating circle that has all of the numbers listed one time on it with a slot in the middle for each one. As the ball rolls, it slows down and drops into one of these holes. This is where probability comes into play. Depending on the player’s bet, they have an x/38 chance of winning. If they select one number, it gives 1/38 or 2.6% chance; for 1-12 its 6/19 or 31.5%. By using a combination of bets, a player can increase their probability of winning by selecting more than one number. Due to Roulettes simplicity, it would make a good beginning topic for a student who is beginning to learn about probability.

Blackjack is game that uses cards to determine who wins or loses, instead of a ball and a wheel. The object of this game is to get as close to 21 as possible without going over, as well as attempting to beat the hand “The House” is holding. While there are a lot of calculations that must go in when calculating probability in a game of blackjack, it is possible to do it on a smaller scale. To do so, a player would have to look at what cards had come up in the past and then look to see what card it is that they need. Since there are only 4 of each card in the deck, assuming the player nor “The House” is holding the card he/she needs, the probability would be 4/(52 – y), where y is the number of cards that have already been shown and are not the card the player needs. Texas Hold’em uses this same kind of idea, but instead is used when playing against other people rather than against “The House”. This version of poker has become so well known, it is featured on an ESPN sports channel, where people play in a live tournament and compete for millions of dollars. What is significant about this channel is that they show what cards each of the players are holding as well as what cards are on the table. Then, once every player’s cards are seen, the channel shows on one side of the screen a player’s percent chance of winning. This percent is calculated by an analysis of what cards are in the player’s hand, what cards are in everyone else’s hands, and what cards are on the board. After analyzing the cards, it is then calculated what the probability is that the best possible cards the player needs are going to come up. Even though only basic probability is being used here, this is still on a much higher difficulty due to the amount of numbers that must be processed. However, given its complexity and how the probability can change by the turn of a card can make both Blackjack and Texas Hold’em an interesting topic for a student of probability.


Engaging students: Combinations

In my capstone class for future secondary math teachers, I ask my students to come up with ideas for engaging their students with different topics in the secondary mathematics curriculum. In other words, the point of the assignment was not to devise a full-blown lesson plan on this topic. Instead, I asked my students to think about three different ways of getting their students interested in the topic in the first place.

I plan to share some of the best of these ideas on this blog (after asking my students’ permission, of course).

This student submission again comes from my former student Taylor Vaughn. Her topic, from probability: combinations.

green line

How could you as a teacher create an activity or project that involves your topic?

One interesting way that I thought about introducing combinations is bringing in combinations that students do often, but do not really think about. When it is known that the family is going on vacation, as a girl, the first thought is “what am I going to wear?” Being a girl, I was always told that I cant pack as much as I wanted to because I also wanted to bring extra clothes just in case I didn’t want to wear what I had planned for that day. One activity I thought bout is actually bring in a suitcase to class with clothes and try and plan a 3 day vacation and figure out how we, as a class, was going to pack this suitcase. I could include different scenarios such as, if the hotel has a laundry room, and how would being able to wash clothes and put them back in the suitcase change how we pack. Also, what happens if we add shoes and socks? How would this change affect the number of combinations we can have? I think it would be really cool for students to touch and play and bring in ideas that they don’t necessarily think has anything to do with math.

green line

How has this topic appeared in pop culture (movies, TV, current music, video games, etc.)?

Everyone listens to music, but there are so many different types of genres, artists, and songs. Have you ever thought, “Will we ever run out of new music?” Well someone by the name of Michael has. He has done the research of what others say about the math of the order of the notes and how many combinations of these notes can we get that will create a new song

One activity that could be done after the video is given 8 notes, how many different measures could students in the class come up with. Then the whole class could see how many people got the same measure or did everyone get something completely different. Then you could also ask “Did we cover all the possibilities? How do we know? How can we show this mathematically?” Lastly, if there are so many possibilities, why are there so many songs with the melodies? There is a video that has one melody and sings a lot of songs to that one melody. (PG-13 Warning: gratuitous cursing near the end of the video.)

The one thing I didn’t like about the first video is the length and he makes connections about songs that are really outdated. SO this video has songs that will relate closer to this generation of students.


green line

How can this topic be used in your students’ future courses in mathematics or science?      In school, students that didn’t like math the way I did always asked, “Well when will we ever use this again?” Well even though we use combinations more than we think, it can also be used in later math classes. Ever thought that combinations had anything to do with Pascal’s triangle? What is Pascal’s triangle, you may ask? Well according to Math Is Fun, it is a pattern of numbers where the starting number is 1 and “each number is the two numbers above it added together (except for the edges, which are all “1”).” Well what if you are asked to find entry 20 of the triangle. The one thing I would do would keep the pattern of the triangle and write out all the entries until I got to that number, but using combinations you can get any entry you would like without writing all the entries out. The formula is where n is the row and k is where it is in the nth row.

\displaystyle {n \choose k} = \frac{n!}{k! (n-k)!}

While teaching this, I would definitely talk about factorial and how it relates to the lesson.
References

Stevens, Michael. “Will We Ever Run Out of New Music?” YouTube. YouTube, 20 Nov. 2012. Web. 02 Sept. 2015.

The Axis of Awesome. “4 Chords.” YouTube. YouTube, 20 July 2011. Web. 02 Sept. 2015.

Pierce, Rod. “Pascal’s Triangle” Math Is Fun. Ed. Rod Pierce. 30 Mar 2014. 3 Sep 2015 http://www.mathsisfun.com/pascals-triangle.html