My colleague Jason Ermer at Collaborative Mathematics is back from summer hiatus and has published Challenge 16 on his website: http://www.collaborativemathematics.org/challenge16.html
My colleague Jason Ermer at Collaborative Mathematics is back from summer hiatus and has published Challenge 16 on his website: http://www.collaborativemathematics.org/challenge16.html
In my capstone class for future secondary math teachers, I ask my students to come up with ideas for engaging their students with different topics in the secondary mathematics curriculum. In other words, the point of the assignment was not to devise a full-blown lesson plan on this topic. Instead, I asked my students to think about three different ways of getting their students interested in the topic in the first place.
I plan to share some of the best of these ideas on this blog (after asking my students’ permission, of course).
This student submission comes from my former student Belle Duran. Her topic, from Geometry: deriving the Pythagorean theorem.

How can technology be used to effectively engage students with this topic?
Using the video in which the scarecrow from The Wizard of Oz “explains” the Pythagorean theorem, I can get the students to review what the definition of it is. Since the scarecrow’s definition was wrong, I can ask the students what was wrong with his phrasing (he said isosceles, when the Pythagorean theorem pertains to right triangles). Thus, I can ask why it only relates to right triangles, starting the proof for the Pythagorean theorem.
What interesting things can you say about the people who contributed to the discovery and/or the development of this topic?
While Pythagoras is an important figure in the development of mathematics, little is truly known about him since he was the leader of a half religious, half scientific cult-like society who followed a code of secrecy and often presented Pythagoras as a god-like figure. These Pythagoreans believed that “number rules the universe” and thus gave numerical values to many objects and ideas; these numerical values were endowed with mystical and spiritual qualities. Numbers were an obsession for these people, so much so that they put to death a member of the cult who founded the idea of irrational numbers through finding that if we take the legs of measure 1 of an isosceles right triangle, then the hypotenuse would be equal to sqrt(2). The most interesting of all, is the manner in which Pythagoras died. It all roots back to Pythagoras’ vegetarian diet. He had a strong belief in the transmigration of souls after death, so he obliged to become a vegetarian to avoid the chance of eating a relative or a friend. However, not only did he abstain from eating meat, but also beans since he believed that humans and beans were spawned from the same source, hence the human fetal shape of the bean. In a nutshell, he refused access to the Pythagorean Brotherhood to a wealthy man who grew vengeful and thus, unleashed a mob to go after the Brotherhood. Most of the members were killed, save for a few including Pythagoras (his followers created a human bridge to help him out of a burning building). He was meters ahead from the mob, and was about to run into safety when he froze, for before him stretched a vast bean field. Refusing to trample over a single bean, his pursuers caught up and immediately ended his life.
How has this topic appeared in the news?
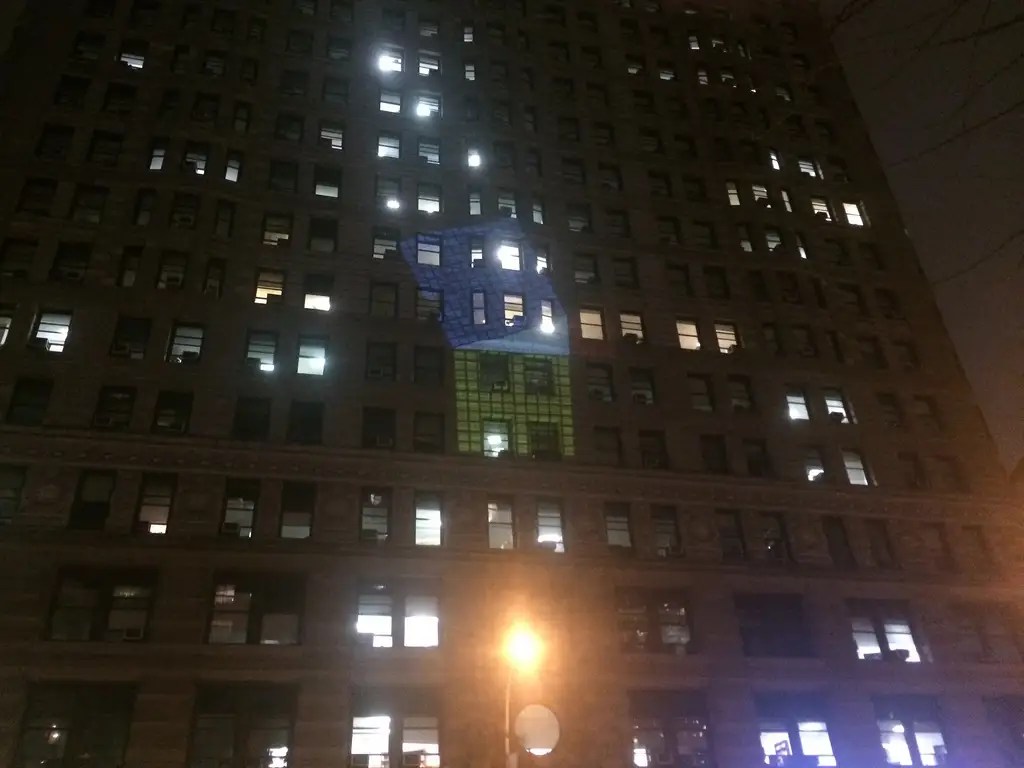
Dallas Cowboys coach, Jason Garrett recently made it mandatory for his players to know the Pythagorean theorem. He wants his players to understand that “’if you’re running straight from the line of scrimmage, six yards deep…it takes you a certain amount of time…If you’re doing it from ten yards inside and running to that same six yards, that’s the hypotenuse of the right triangle’” (NBC Sports). Also, recently the Museum of Mathematics (MoMath) and about 500 participants recently proved that New York’s iconic Flatiron building is indeed a right triangle. They measured the sides of the building by first handing out glow sticks for the participants to hold from end to end, then by counting while handing out the glow sticks, MoMath was able to estimate the length of the building in terms of glow sticks.

The lengths came out to be 75^2 + 180^2 = 38,025. After showing their Pythagorean relationship, MoMath projected geometric proofs on the side of the Flatiron building.
References
http://www.youtube.com/watch?v=DUCZXn9RZ9s
http://www.youtube.com/watch?v=X1E7I7_r3Cw
I really enjoyed this video… I’ve always had a soft spot for building scale models of the solar system.
To Scale: The Solar System from Wylie Overstreet on Vimeo.
Here’s the companion “making of” video:
When I have time to kill in a new library or bookstore, I inevitably find myself wandering to the math section — looking not for new textbooks but for decent books aimed at the popularization of mathematics. Sadly, the books I find are usually in one of three categories:
There’s nothing particularly wrong with any of these types of books — and there’s a few that I could recommend from each category — but it’s rare to find a good math book that doesn’t fit one of these molds.
Enter Math Girls, by Hiroshi Yuki, which features conversations between high school students talk about love and talk about math. I won’t write a full review — the one at MAA Reviews does a really good job at describing the book, as well as the one published in the Notices of the American Mathematical Society — but I will list some of the mathematical ideas that the book’s characters discuss:
 (see Equation 22 from Mathworld)
What’s unique about Math Girls is that the logical development of all of these topics are present, as opposed a cursory summary typically found in a book of mathematical facts. That said, the logical development is not the clean and sanitized presentation that would be found in a textbook. Instead, the topics are presented as if the young characters were discovering them for themselves, with more than a few false starts and mistakes along the way. In other words, the book feels a bit like the work of real mathematicians, which makes it fairly unique for math books intended for a popular audience.
Again, I’ll defer to MAA Reviews. and the Notices of the AMS for anyone interested in a lengthier review of the book. There’s also a second volume (Math Girls 2: Fermat’s Last Theorem) that I haven’t read yet, but I presume that the style is very similar.
In my capstone class for future secondary math teachers, I ask my students to come up with ideas for engaging their students with different topics in the secondary mathematics curriculum. In other words, the point of the assignment was not to devise a full-blown lesson plan on this topic. Instead, I asked my students to think about three different ways of getting their students interested in the topic in the first place.
I plan to share some of the best of these ideas on this blog (after asking my students’ permission, of course).
This student submission again comes from my former student Banner Tuerck. His topic, from Algebra: factoring polynomials.
A1. What interesting (i.e., uncontrived) word problems using this topic can your students do now?
In relation to a specific case one can generate a word problem well within their students reach by relating the factors of a said quadratic polynomial to the length and width of a rectangle or perfect square. Many online resources, such as http://www.purplemath.com/, offer diverse and elaborate examples one could use in order to facilitate this concept. Nevertheless, this way of viewing a factored polynomial may appear more comfortable to a class because it is applying the students preexisting knowledge of area to the new algebraic expressions and equations. Furthermore, it has been my experience that geometric activities interrelating algebra aid in straying students away from ignoring the variable in an expression as a value.
A garden measuring 12 meters by 16 meters is to have a pedestrian pathway installed all around it, increasing the total area to 285 square meters. What will be the width of the pathway?

The above problem is a prime example pulled from the Purple Math website one could use to illustrate a physical situation in which we need to actually determine the factors in order to formulate a quadratic expression to solve for the width. It should be noted that some of these particular word problems can quickly fall into a lesson relating more towards distributing and foiling factors to form an expanded form equation. However, as an instructor one can easily work backwards from an expanded equation to interpret what the factored form can tell us, say about the garden with respect to the example given above.
B1. How can this topic be used in your students’ future courses in mathematics or science?
Factoring polynomials allows students to further comprehend the properties of these expressions before they are later applied as functions in areas such as mathematics and physics. For example, projectile motion stands as a great real world topic capable of enlightening students further on the factors of the polynomial. Specifically, how these factors come about geometrically and how knowing their role will benefit our understanding of the functions potential real world meaning. Lastly, factoring polynomials and evaluating them as roots during middle and high school mathematics will definitely be used when students approach college level calculus courses in relation to indefinite and definite integrals. The previous are just a few examples of how factoring polynomials plays a role in students’ future courses.
How can technology (YouTube, Khan Academy [khanacademy.org], Vi Hart, Geometers Sketchpad, graphing calculators, etc.) be used to effectively engage students with this topic?
Doing a simple YouTube search of the phrase “factoring polynomials” allows anyone access to nearly 57,000 videos of various tutors, instructors, and professors discussing factoring and distributing respectfully. I would say that future generations will definitely not be without resources. That is not even to mention the revolutionary computation website that is www.wolframalpha.com. This website in and of itself will allow so many individuals to see various forms of a factored polynomial, as well as the graph, roots (given from factors), domain, range, etc. Essentially, computation websites like Wolfram Alpha are intended to allow students the opportunity to discover properties, relationships, and patterns independently. However, there is a potential risk for such websites to become a crutch the students use in order to get good grades as opposed to furthering their understanding. Similarly, with the advancing technology of graphing calculators students will become more engaged when discussing polynomial factorization for the first time in class. Many modern calculators have the ability to identify roots, give a table of coordinates, trace graphs, etc. Some even have a LCD screen or a backlit display to aid in viewing various graphs. Although, just as with computation engines, calculators could potentially distract students from thinking about their problem solving method by them just letting the calculator take over the calculation process. Therefore, I would suggest using caution regarding how soon calculators are introduced when initially engaging a class in factoring polynomials.
References:
http://www.purplemath.com/modules/quadprob2.htm
https://www.youtube.com/results?search_query=factoring+polynomials
In my capstone class for future secondary math teachers, I ask my students to come up with ideas for engaging their students with different topics in the secondary mathematics curriculum. In other words, the point of the assignment was not to devise a full-blown lesson plan on this topic. Instead, I asked my students to think about three different ways of getting their students interested in the topic in the first place.
I plan to share some of the best of these ideas on this blog (after asking my students’ permission, of course).
This student submission again comes from my former student Nada Al-Ghussain. Her topic, from Algebra: graphs of linear equations.
How could you as a teacher create an activity or project that involves your topic?
Positive slope, negative slope, no slope, and undefined, are four lines that cross over the coordinate plane. Boring. So how can I engage my students during the topic of graphs of linear equations, when all they can think of is the four images of slope? Simple, I assign a project that brings out the Individuality and creativity of each student. Something to wake up their minds!
An individualized image-graphing project. I would give each student a large coordinate plane, where they will graph their picture using straight lines only. I would ask them to use only points at intersections, but this can change to half points if needed. Then each student will receive an Equation sheet where they will find and write 2 equations for each different type of slope. So a student will have equations for two horizontal lines, vertical lines, positive slope, and negative slope. The best part is the project can be tailored to each class weakness or strength. I can also ask them to write the slop-intercept form, point slope form, or to even compare slopes that are parallel or perpendicular. When they are done, students would have practiced graphing and writing linear equations many times using their drawn images. Some students would be able to recognize slopes easier when they recall this project and their specific work on it.
Example of a project template:

Examples of student work:


How has this topic appeared in the news?
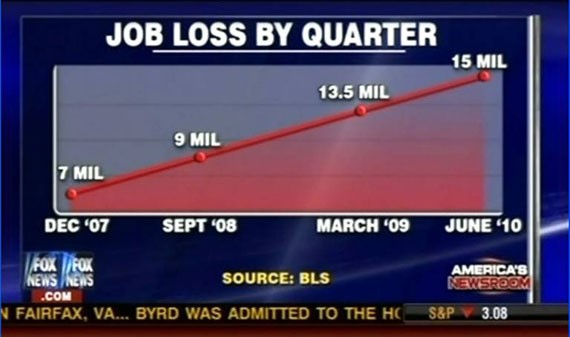
Millions of people tune in to watch the news daily. Information is poured into our ears and images through our eyes. We cannot absorb it all, so the news makes it easy for us to understand and uses graphs of linear equations. Plus, the Whoa! Factor of the slopping lines is really the attention grabber. News comes in many forms either through, TV, Internet, or newspaper. Students can learn to quickly understand the meaning of graphs with the different slopes the few seconds they are exposed to them.
On television, FOX news shows a positive slope of increasing number of job losses through a few years. (Beware for misrepresented data!)
A journal article contains the cost of college increase between public and private colleges showing the negative slope of private costs decreasing.

Most importantly line graphs can help muggles, half bloods, witches, and wizards to better understand the rise and decline of attractive characters through the Harry Potter series.

How can this topic be used in your students’ future courses in mathematics or science?
Students are introduced to simple graphs of linear equations where they should be able to name and find the equation of the slope. In a student’s future course with computers or tablets, I would use the Desmos graphing calculator online. This tool gives the students the ability to work backwards. I would ask a class to make certain lines, and they will have to come up with the equation with only their knowledge from previous class. It would really help the students understand the reason behind a negative slope and positive slope plus the difference between zero slope and undefined. After checking their previous knowledge, students can make visual representations of graphing linear inequalities and apply them to real-world problems.
References:
http://www.hoppeninjamath.com/teacherblog/?p=217
http://mediamatters.org/research/2012/10/01/a-history-of-dishonest-fox-charts/190225
http://money.cnn.com/2010/10/28/pf/college/college_tuition/
http://dailyfig.figment.com/2011/07/13/harry-potter-in-charts/
https://www.desmos.com/calculator
The Mathematical Association of America recently published a number of promotional videos showing various mathematics can be used in “the real world.” Here’s the fourth pair of videos describing how mathematics is used in the world of finance. From the YouTube descriptions:
Dr. Jonathan Adler (winner of King of the Nerds Season 3) talks about his career path and about a specific research problem that he has worked on. Using text analytics he was able to help an online company distinguish between its business customers and its private consumers from gift card messages.
Prof. Talithia Williams of Harvey Mudd College explains the statistical techniques that can be used to classify customers of a company using the messages on their gift cards.
Let me take a one-day break from my current series of posts to wish everyone a Happy Pythagoras Day! Today is 8/17/15 (or 17/8/15 in other parts of the world), and 

Bonus points if you can figure out (without Googling) when the next four Pythagoras Days will be. One of the next four is easy, two others aren’t so hard, but the fourth might take some thought.
We are approaching the 70th anniversary of VJ Day (August 14, 1945), which marked the end of World War II. And perhaps the iconic photograph of that day is the picture of two anonymous strangers kissing in New York City’s Times Square celebrating the end of the war.

And a question that is still unresolved after 70 years is: Who are they?
The short answer is, Nobody knows for certain. But in a clever bit of geometric and astronomical forensics, physicists at Texas State University (Donald Olson and Russell Doescher) and Iowa State University (Steven D. Kawaler) recently pinpointed the exact time that the photograph was taken: 5:51 pm, or about an hour before President Truman formally announced that the war was over. From the press release:
Overlooked in the right hand background of the photo is the Bond Clothes clock. The minute hand of this clock is clear, but the oblique angle of view and the clock’s unusually short hour hand makes a definitive reading of the time difficult. The clock might show a time near 4:50, 5:50, or 6:50 p.m. A prominent shadow falls across the Loew’s Building just beyond the clock, however, and this shadow could potentially give just as accurate a time reading as the clock.
Every tall building in Manhattan acts as a sundial, its cast shadow moving predictably as the sun traverses the sky. In this case, the Texas State team studied hundreds of photographs and maps from the 1940s to identify the source of the shadow, considering, in turn, the Paramount Building, the Hotel Lincoln and the Times Building. The breakthrough came when a photograph of the Astor Hotel revealed a large sign shaped like an inverted L that advertised the Astor Roof garden.
Calculations showed that only the Astor Roof sign could have cast the shadow, but to be certain, Olson and Doescher built a scale model of the Times Square buildings with a mirror to project the sun’s rays. The location, size and shape of the shadow on the model exactly matched the shadow in Eisenstaedt’s kiss photographs.
So who are the kissers? Again from the press release:
Over the years, dozens of men and women have come forward claiming to be the persons in the photograph. All have different stories, but the one thing they share in common is kissing a stranger in Times Square that fateful day.
“All those people have said they were there and identify themselves in the photograph,” Olson said. “Who’s telling the truth? They all could be telling the truth about kissing someone. They were probably all there, and kisses were common in Times Square on VJ Day.
“I can tell you some things about the picture, and I can rule some people out based on the time of day,” he said. “We can show that some of the accounts are entirely inconsistent with the astronomical evidence”…
“Astronomy alone can’t positively identify the participants, but we can tell you the precise moment of the photograph,” Olson said. “Some of the accounts are inconsistent with the astronomical evidence, and we can rule people out based on the position of the sun. The shadows were the key to unlocking some of the secrets of the iconic VJ Day images–we know when the famous kiss happened, and that gives us some idea of who might or might not have been in the picture.”
“There are probably 50 or 60 sailors who have come forward and say, ‘That’s me! I’m the guy in the photograph.’ Fewer women, maybe five or six women, have said they’re the woman in white. There are articles all over the internet advocating for one [or] the other,” Olson said.
Olson can’t say who is correct, but he can rule out a few.
“What we can do is calculate the precise time, 5:51 p.m., when the photograph was taken. That does appear to rule out some of the widely accepted candidates,” he said.
The full article has been published in the August 2015 issue of Sky and Telescope magazine (sorry, you’ll have to buy a copy in you want to read the article). I also recommend clicking through the photographs in the press release; the captions of the photographs give many details of how the time of 5:51 pm was pinpointed.

