Last March, on Pi Day (March 14, 2015), I put together a mathematical magic show for the Pi Day festivities at our local library, compiling various tricks that I teach to our future secondary teachers. I was expecting an audience of junior-high and high school students but ended up with an audience of elementary school students (and their parents). Still, I thought that this might be of general interest, and so I’ll present these tricks as well as the explanations for these tricks in this series. From start to finish, this mathematical magic show took me about 50-55 minutes to complete. None of the tricks in this routine are original to me; I learned each of these tricks from somebody else.

This is a magic trick that my math teacher taught me when I was about 13 or 14. I’ve found that it’s a big hit when performed for grade-school children. Here’s the patter:
Magician: Tell me a number between 5 and 10.
Child: (gives a number, call it  )
)
Magician: On a piece of paper, draw a shape with corners.
Child: (draws a figure; an example for  is shown)
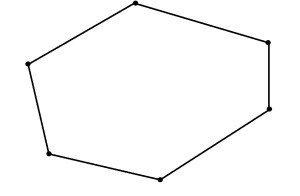 Important Note: For this trick to work, the original shape has to be convex… something shaped like an L or M won’t work. Also, I chose a maximum of 10 mostly for ease of drawing and counting (and, for later, calculating).
Magician: Tell me another number between 5 and 10.
Child: (gives a number, call it  )
)
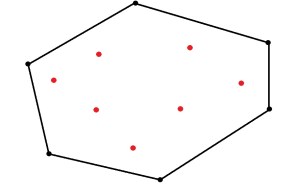
Magician: Now draw that many dots inside of your shape.
Child: (starts drawing dots inside the figure; an example for  ) While the child does this, the Magician calculates
  , writes the answer on a piece of paper, and turns the answer face down.
 Magician: Now connect the dots with lines until you get all triangles. Just be sure that no two lines cross each other.
Child: (connects the dots until the shape is divided into triangles; an example is shown)
 Magician: Now count the number of triangles.
Child: (counts the triangles)
Magician: Was your answer… (and turns the answer over)?
The reason this magic trick works so well is that it’s so counter-intuitive. No matter what convex  gon is drawn, no matter where the points are located, and no matter how lines are drawn to create triangles, there will always be triangles. For the example above,
  , and there are indeed
  triangles in the figure.
This trick works by counting the measures of all the angles in two different ways.
Method #1: If there are  triangles created, then the sum of the measures of the angles in each triangle is
  degrees. So the sum of the measures of all of the angles must be
  degrees.
 Method #2: The sum of the measures of the angles around each interior point is
  degrees. Since there are interior points, the sum of these angles is
  degrees.
 The measures of the remaining angles add up to the sum of the measures of the interior angles of a convex polygon with sides. So the sum of these measures is
  degrees.
 These two different ways of adding the angles must be the same. In other words, it must be the case that
 ,
,
or
 .
.
I’m often asked why it was important to choose a number between 5 and 10. The answer is, it’s not important. The trick will work for any numbers as long as there are at least three sides of the polygon. However, in a practical sense, it’s a good idea to make sure that the number of sides and the number of points aren’t too large so that the number of triangles can be counted reasonably quickly.
After explaining how the trick works, I’ll again ask a child to stand up and play the magician, repeating the trick that I just did, before I move on to the next trick.
be the proposition “You can write in the proper way,” let
be the proposition “You know how to conjugate,” and let
be the proposition “People mock you online.” Express the implication


 in ordinary English.


 for the number of triangles if the initial figure is a triangle.
 .
. .
. .
. .
. sides? By now, they should get the correct answer,
  .
.


