In my capstone class for future secondary math teachers, I ask my students to come up with ideas for engaging their students with different topics in the secondary mathematics curriculum. In other words, the point of the assignment was not to devise a full-blown lesson plan on this topic. Instead, I asked my students to think about three different ways of getting their students interested in the topic in the first place.
I plan to share some of the best of these ideas on this blog (after asking my students’ permission, of course).
This student submission again comes from my former student Kelley Nguyen. Her topic, from Algebra: slope-intercept form of a line.

How has this topic appeared in high culture (art, classical music, theatre, etc.)?
The slope-intercept form of a line is a linear function. Linear functions are dealt with in many ways in everyday life, some of which you probably don’t even notice.
One example where the slope-intercept form of a line appears in high culture is through music and arts. Suppose a band wants to book an auditorium for their upcoming concert. As most bands do, they meet with the manager of the location, book a date, and determine a payment. Let’s say it costs $1,500 to rent the building for 2 hours. In addition to this fee, the band earns 20% of each $30 ticket sold. Write an equation that determines whether the band made profit or lost money due to the number of tickets sold – the equation would be y = 0.2(30)x – 1500, where y is the amount gained or lost and x is the number of tickets sold that night. This can also help the band determine their goal on how many tickets to sell. If they want to make a profit of $2,000, they would have to sell x-many tickets to accomplish that.
In reality, most arts performances make a profit from their shows or concerts. Not only do mathematicians and scientists use slope-intercept of a line, but with this example, it shows up in many types of arts and real-world situations. Not only does the form work for calculating cost or profit, it can relate to the number of seats in a theatre, such as x rows of 30 seats and a VIP section of 20 seats. The equation to find how many seats are available in the theatre is y = 30x + 20, where x is the number of rows.
How can technology be used to effectively engage students with this topic?
A great way to engage students when learning about slope-intercept form of a line is to use Geometer’s Sketchpad. After opening a graph with an x- and y-axis, use the tools to create a line. From there, you can drag the line up or down and notice that the slope increases as you move upward and decreases as you move downward. Students can also find the equation of the line by selecting the line, clicking “Measure” in the menu bar, and selecting “Equation” in the drop-down list. This gives the students an accurate equation of the line they selected in slope-intercept form. Geometer’s Sketchpad allows students to experiment and explore directions of lines, determine whether or not it has an increasing slope, and help create a visual image for positive and negative slopes.
Also, with this program, students can play a matching game with slope-intercept equations and lines. You will instruct the student to create five random lines that move in any direction. Next, they will select all of the lines, go to “Measure” in the menu bar, and click “Equation.” From there, it’ll give them the equation of each line. Then, the student will go back and select the lines once again, go to “Edit” on the menu bar, hover over “Action Buttons,” and select “Hide/Show.” Once a box comes up, they will click the “Label” tab and type Scramble Lines in the text line. Next, the lines will scramble and stop when clicked on. Once the lines are done scrambling, the student could then match the equations with their lines. This activity gives the students the chance to look at equations and determine whether the slope is increasing and decreasing and where the line hits the y-axis.
How could you as a teacher create an activity or project that involves your topic?
With this topic, I could definitely do a project that consists of slope-intercept equations, their graphs, and word problems that involve computations. For example, growing up, some students had to earn money by doing chores around the house. Parents give allowance on daily duties that their children did.
The project will give the daily amount of allowance that each student earned. With that, say the student needed to reach a certain amount of money before purchasing the iPad Air. In part one of the project, the student will create an equation that reflects their daily allowing of $5 and the amount of money they have at the moment. In part two, the student will construct a graph that shows the rate of their earnings, supposing that they don’t skip a day of chores. In part three, the students will answer a series of questions, such as,
- What will you earn after a week?
- What is your total amount of money after that week?
- When will you have enough money to buy that iPad Air at $540 after tax?
This would be a short project, but it’s definitely something that the students can do outside of class as a fun activity. It can also help them reach their goals of owning something they want and making a financial plan on how to accomplish that.
References


 vs.
vs. 

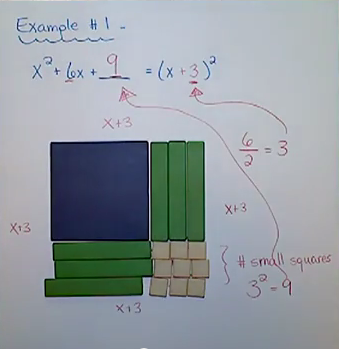
 are (x+3) and (x+1). Just like how when we multiply two times three we get six, when we multiply (x+3) times (x+1) we get the expression