Engaging students: Slope-intercept form of a line

In my capstone class for future secondary math teachers, I ask my students to come up with ideas for engaging their students with different topics in the secondary mathematics curriculum. In other words, the point of the assignment was not to devise a full-blown lesson plan on this topic. Instead, I asked my students to think about three different ways of getting their students interested in the topic in the first place.

I plan to share some of the best of these ideas on this blog (after asking my students’ permission, of course).

This student submission again comes from my former student Kelley Nguyen. Her topic, from Algebra: slope-intercept form of a line.

green line

How has this topic appeared in high culture (art, classical music, theatre, etc.)?


The slope-intercept form of a line is a linear function. Linear functions are dealt with in many ways in everyday life, some of which you probably don’t even notice.


One example where the slope-intercept form of a line appears in high culture is through music and arts. Suppose a band wants to book an auditorium for their upcoming concert. As most bands do, they meet with the manager of the location, book a date, and determine a payment. Let’s say it costs $1,500 to rent the building for 2 hours. In addition to this fee, the band earns 20% of each $30 ticket sold. Write an equation that determines whether the band made profit or lost money due to the number of tickets sold – the equation would be y = 0.2(30)x – 1500, where y is the amount gained or lost and x is the number of tickets sold that night. This can also help the band determine their goal on how many tickets to sell. If they want to make a profit of $2,000, they would have to sell x-many tickets to accomplish that.


In reality, most arts performances make a profit from their shows or concerts. Not only do mathematicians and scientists use slope-intercept of a line, but with this example, it shows up in many types of arts and real-world situations. Not only does the form work for calculating cost or profit, it can relate to the number of seats in a theatre, such as x rows of 30 seats and a VIP section of 20 seats. The equation to find how many seats are available in the theatre is y = 30x + 20, where x is the number of rows.


green line

How can technology be used to effectively engage students with this topic?


A great way to engage students when learning about slope-intercept form of a line is to use Geometer’s Sketchpad. After opening a graph with an x- and y-axis, use the tools to create a line. From there, you can drag the line up or down and notice that the slope increases as you move upward and decreases as you move downward. Students can also find the equation of the line by selecting the line, clicking “Measure” in the menu bar, and selecting “Equation” in the drop-down list. This gives the students an accurate equation of the line they selected in slope-intercept form. Geometer’s Sketchpad allows students to experiment and explore directions of lines, determine whether or not it has an increasing slope, and help create a visual image for positive and negative slopes.


Also, with this program, students can play a matching game with slope-intercept equations and lines. You will instruct the student to create five random lines that move in any direction. Next, they will select all of the lines, go to “Measure” in the menu bar, and click “Equation.” From there, it’ll give them the equation of each line. Then, the student will go back and select the lines once again, go to “Edit” on the menu bar, hover over “Action Buttons,” and select “Hide/Show.” Once a box comes up, they will click the “Label” tab and type Scramble Lines in the text line. Next, the lines will scramble and stop when clicked on. Once the lines are done scrambling, the student could then match the equations with their lines. This activity gives the students the chance to look at equations and determine whether the slope is increasing and decreasing and where the line hits the y-axis.


green line

How could you as a teacher create an activity or project that involves your topic?


With this topic, I could definitely do a project that consists of slope-intercept equations, their graphs, and word problems that involve computations. For example, growing up, some students had to earn money by doing chores around the house. Parents give allowance on daily duties that their children did.


The project will give the daily amount of allowance that each student earned. With that, say the student needed to reach a certain amount of money before purchasing the iPad Air. In part one of the project, the student will create an equation that reflects their daily allowing of $5 and the amount of money they have at the moment. In part two, the student will construct a graph that shows the rate of their earnings, supposing that they don’t skip a day of chores. In part three, the students will answer a series of questions, such as,

  • What will you earn after a week?
  • What is your total amount of money after that week?
  • When will you have enough money to buy that iPad Air at $540 after tax?


This would be a short project, but it’s definitely something that the students can do outside of class as a fun activity. It can also help them reach their goals of owning something they want and making a financial plan on how to accomplish that.


References


Engaging students: Word problems involving inequalities

In my capstone class for future secondary math teachers, I ask my students to come up with ideas for engaging their students with different topics in the secondary mathematics curriculum. In other words, the point of the assignment was not to devise a full-blown lesson plan on this topic. Instead, I asked my students to think about three different ways of getting their students interested in the topic in the first place.

I plan to share some of the best of these ideas on this blog (after asking my students’ permission, of course).

This student submission again comes from my former student Emily Bruce. Her topic, from Algebra: word problems involving inequalities.

green line

How could you as a teacher create an activity or project that involves your topic?

Everyone learns in different ways. There are three common learning types, which are auditory, visual, and kinesthetic. The best activities and lesson plans involve all three of these learning styles. A great way to involve all of these learning styles is to use objects that students can rearrange and manipulate with their hands. When learning about inequality word problems, I would have print large numbers and symbols on pieces of paper that they could tape to a whiteboard. In groups, they would be able to rearrange their numbers and inequality symbols as they are working through a word problem, until the figure out the correct inequality. Then as a class, we could discuss their answers. This addresses the auditory, by discussing, the visual, by them seeing the inequalities as they read them, and the kinesthetic learners, by being able to manipulate it using their hands.


green line

What are the contributions of various cultures to this topic?

The strict inequality symbols (less than and greater than) were originally seen in 1631, when used by British mathematician, Thomas Harriot. Some believe that his inspiration for these symbols came from a symbol that he saw on the arm of a Native American. The symbol he saw looked like the strict inequality symbols overlapping. The bars for the unstrict inequalities (less than or equal to and greater than or equal to) were not added until much later. It wasn’t until almost 40 years later, in 1670, that John Wallis started putting a line above the strict inequality symbols. Almost 65 years after that, in 1734, French mathematician, Pierre Bouguer, began writing a double line underneath the inequality symbols.


http://jeff560.tripod.com/relation.html

http://en.wikipedia.org/wiki/Table_of_mathematical_symbols_by_introduction_date


green line

How can technology be used to effectively engage students with this topic?

Quizlet.com is a website that can be used as a good review for many topics. When exploring the section on inequality word problems, I found many useful and engaging things that would help students review and study the material. There were flash cards with word problems on one side and the corresponding equations on the flip side. There was also a test that they could take after studying the material, in order to examine their progress. Lastly, the website had two games that involve solving inequality word problems. This is a great way for students to study and review material. The website is not only great for inequality word problems, but topics of all kinds, in all subjects.


Engaging students: The quadratic formula

In my capstone class for future secondary math teachers, I ask my students to come up with ideas for engaging their students with different topics in the secondary mathematics curriculum. In other words, the point of the assignment was not to devise a full-blown lesson plan on this topic. Instead, I asked my students to think about three different ways of getting their students interested in the topic in the first place.

I plan to share some of the best of these ideas on this blog (after asking my students’ permission, of course).

This student submission again comes from my former student Chais Price. His topic, from Algebra: the quadratic formula.

green line

What interesting things can you say about the people who contributed to the discovery and/or the development of this topic?

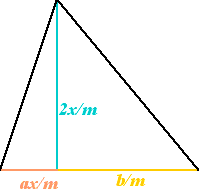
What is the quadratic formula you ask? It is basically a tool used to find roots of the quadratic equation. It all started around 3000 BC,when the Ancient Babylonians needed a method for calculating how much to pay the tax collector. Imagine that you are an Ancient Babylonian farmer with a square field that is placed in the middle of your farm. On this field you plan to plant some crops. After some experimenting you discover that if you double the length of each side of the square field, you end up with 4 times as many crops as before. This observation demonstrated the area of the field and the amount of crops that you can grow and the square of one of the side lengths are all proportional. From here we come up with the first quadratic equation. Let “x” represent the length of a side and “m” be the amount of crops you can grow on a square field of side length 1. Then we have “c” which is the entire area of crop that can be grown. Thus c= mx^2. It is now April 15 in Babylonia and the tax collector comes and says to give him “c” crops to pay your taxes. Now you ask yourself, how big does your square field need to be to grow that amount of crops? Well as it turns out, we just take x= (c/m)^1/2. The Babylonians however, did not have a way to solve square roots accurately. They were just estimations. This square field representation is just a basic representation. Let’s say that your field was not a square but a triangle divided into 2 right triangles where a and b are the amount of crops that you can grow in each field.

triangle

To calculate the amount of crops, you being a very intelligent Babylonian farmer, you come up with the equation

c= ax^2+bx.

The next step is to divide by “a” and then complete the square yielding

a \displaystyle \left(x + \frac{b}{2a} \right)^2 = x^2 + \displaystyle \frac{b}{a}x + \displaystyle \frac{b^2}{4a^2}

Now we substitute into the previous equation. We now have an equation of the form

a \displaystyle\left( x + \frac{b}{2a} \right)^2 = c + \displaystyle \frac{b^2}{4a^2}

Solving again for the tax collector, we need to solve for “x.” This gives us what we know as the quadratic formula:

x = \displaystyle \frac{-b \pm \sqrt{b^2 + 4ac}}{2a}

Something worth noting since you are an Ancient Babylonian farmer, is that all the roots you find are positive since negative numbers have not been discovered yet. In addition, the quadratic formula shown above is just an illustration broken down step by step. The Babylonians had no general formula for the quadratic formula, but there method for the quadratic formula can be closely associated with the method of completing the square.

green line

How has this topic appeared in the news?

There is a pretty interesting article I read which had to do with the quadratic equation. A teacher provided a list of quadratic equations that the students would pick from. This equation was to be to model for a parabolic device that the student was responsible for building. The student was instructed to spend no more than 12 dollars on this project. They would use the equation to calculate a positional focus which suspended a marshmallow which would cook slowly due to the rays of the sun reflected upon it. This lesson stretched using a quadratic equation to form a focus. Then the student would graph the data and calculate the rate of temperature increase. Student were also asked to make predictions on what temperature the marshmallow would get to. Once the experiment is complete, the student is anxious to see how accurate their model is to the actual equation they chose. This is a very good lesson that covers a pretty broad range of topics.

green line

So the concept of the quadratic formula would develop beyond what the Ancient Babylonians discovered. 1500 years after the Babylonians, the Egyptians came along with a different approach for similar type problems where the quadratic formula was used. The mathematics behind the calculations were known to be very complicated. However, they recorded these calculation on a table ( much like our multiplication tables) so that when a farmer or an engineer required some kind of proportion or dimensional measurement using the quadratic formula, rather than solving the problem again, they would just look it up on the table that had already been calculated. They reproduced this table and made it a master look up guide to follow for such solutions.

Then the Babylonians would reappear in time and discover the method of completing the square. This method still required somewhat of an educated guess. However, since the Babylonians had a 60 base numerical system ( which the Egyptians did not) addition and multiplication were easier to compute and check calculations. Even still there was not a general formula or equation established. Then Pythagoras and Euclid came along and developed a general formula to solve the quadratic equation. Pythagoras argued that the ratio of the area of a square and the length of a side does not always produce an integer and indeed can have a rational solution. Euclid advanced beyond Pythagoras and claimed you could have irrational results. These were logical claims made from a theoretical point of view because at that time there was no way to calculate the square root of a number by hand. Finally in 700 AD, a mathematician named Brahmagupta from India came up with a general solution to the quadratic equation using numbers. He also was on board with Euclid and his irrationals as well as an equation producing 2 roots. His work more than likely inspired another Hindu Mathematician named Baskhara who around 1100 AD formulated the complete solution we are familiar with today. He was also the first to acknowledge that any number greater than 0 has 2 square roots. It was around this same time in history that a Jewish mathematician Abraham bar Hiyya derived the quadratic formula and brought it to Europe. It wouldn’t be until another 500 years that the quadratic formula would be adopted into the formula we know today.


Works Cited


Budd, Chris, and Chris Sangwin. “101 Uses of the Quadratic Equation.” Plus Math. Plus Magazine… Living Mathematics , 01 Mar 2004. Web. 10 Sep 2014. http://plus.maths.org/content/101-uses-quadratic-equation

Tracey, Wong Briggs. “Students use quadratic equations to cook marshmallows.” USA Today. USA Today, 05 Mar 2007. Web. 10 Sep 2014. http://usatoday30.usatoday.com/news/education/2007-03-04-teacher-parabola-side_N.htm?csp=34

Hell, Dr. . “The History Behind the Quadratic Formula .” . BBC H2G2, 13 October 2004. Web. 10 Sep 2014. http://news.bbc.co.uk/dna/place-lancashire/plain/A2982567


Engaging students: Computing inverse functions

In my capstone class for future secondary math teachers, I ask my students to come up with ideas for engaging their students with different topics in the secondary mathematics curriculum. In other words, the point of the assignment was not to devise a full-blown lesson plan on this topic. Instead, I asked my students to think about three different ways of getting their students interested in the topic in the first place.

I plan to share some of the best of these ideas on this blog (after asking my students’ permission, of course).

This student submission again comes from my former student Carissa Birdsong. Her topic, from Algebra: computing inverse functions.

green line

How can this topic be used in your students’ future courses in mathematics or science?

When students are learning any algorithm in math, it helps keep their interest if they know what this can be possibly used for in the future. In pre-calculus, students need to find the inverse of cosine, sine, tangent, etc. to find certain angles. In order to grasp the students’ attention, the teacher can show videos of bottle rockets being shot off at different angles. Then the teacher will explain that in order to find most of these angles, one must use the inverse property. Then the teacher can go into depth of how to find the inverse of a function. But, the students must understand that using inverse to find angle measurements will not happen in this curriculum, but in future classes such as pre-calculus, trigonometry and physics.


green line

How could you as a teacher create an activity or project that involves your topic?


Human Representation of Inverse Function

  1. Move the desks to the sides of the room, making a big open space in the middle.
  2. Assign each student a partner.
  3. Have a strip of tape down the middle of the room prior to class. Have the students line up facing their partner with the strip of tape in between them.
  4. Have the side on the “right” be side A and the side on the “left” be side B. (The teacher will choose which side is the right or left, depending on where the front of the classroom is)
  5. Side A will pick a position to stand in (the teacher must monitor to make sure the students are being appropriate). The students are encouraged to change their face, arms, head, etc. to pick the most creative position possible.
  6. Now side B will mimic their specific partner on side A.
  7. Once the students have locked in their position, the teacher will point out that side B is reflective of side A. Therefore, side B is the inverse function of A.

*Make sure that the students understand that side B is not doing the exact same thing that side A is doing, but the opposite, the reflection. The inverse of a function “undoes” the function itself. If someone were to take away side A, and bring in a new crop of people to reflect side B, it should be EXACTLY what side A had done. The inverse of the inverse of a function must take you back to the original function.

*After the teacher teaches how to find the inverse of a function, and can elaborate on the graphing of each function, he or she can refer back to this activity and show that there is an invisible line between the function and the inverse function, making clear that they reflect each other, just as the students did.


green line

How has this topic appeared in pop culture (movies, TV, current music, video games, etc.)?

Even though most students probably haven’t seen Top Secret, they will probably appreciate watching any sort of movie or television during class. In the making of Top Secret, the actors film a scene walking backwards and saying lines in reverse order. In the movie, this scene is played in reverse, so they look like they were just speaking gibberish and walking forward. They did this so Val Kilmer can do cool tricks like throw a book on the top shelve and slide up a pole.

The teacher could show his or her class the original scene, straight from the movie.

Then ask, “How do you think the actors did this?” “What language are they speaking?” Hopefully a student will catch on fast and say that they just filmed it backwards. Then the teacher can show the scene played forwards.

These two scenes are inverse each other. Going from the beginning to the end of one takes you to the beginning of the other. And going from the beginning to the end of the other, takes you to the beginning of one. Most functions have an inverse function. This means there is a function that is reverse of its inverse. This does NOT mean that the inverse of a function is just the original backwards (i.e. y=3+x and x+3=y). The function of f has the input x and the output y, whereas the inverse of the function f has the input y and the output x.

Resources:

https://www.youtube.com/watch?v=jXlucE4iUDE

https://www.youtube.com/watch?v=2Mr_XAM8CMw


Engaging students: Finding the inverse of a matrix

In my capstone class for future secondary math teachers, I ask my students to come up with ideas for engaging their students with different topics in the secondary mathematics curriculum. In other words, the point of the assignment was not to devise a full-blown lesson plan on this topic. Instead, I asked my students to think about three different ways of getting their students interested in the topic in the first place.

I plan to share some of the best of these ideas on this blog (after asking my students’ permission, of course).

This student submission again comes from my former student Donna House. Her topic, from Algebra: finding the inverse of a matrix.

green line

How could you as a teacher create an activity or project that involves your topic?

Engage the students by asking them how they think our military (or a secret agent) sends and receives messages without the enemy knowing what message is being sent. Then the discussion can be guided by asking how math is used in encoding and de-coding secret messages. Since they already will have learned about matrices, tell them they are going to learn how to use matrices to create a secret message and de-code a secret message from a classmate.

First they need to learn to compute the inverse of a simple matrix A (provide this matrix to be certain it has an integer inverse.) I prefer a three-by-three, but this can also be done with any size matrix – even a two-by-two. Next, they create their own short message and code it using numbers to represent the letters of the alphabet (A=1, B=2, etc., with 0=space). This coded message should be written into a matrix form, filling in one row at a time (the number of columns MUST match the number of rows in matrix A.) If the secret message does not fill the last row add zeros for spaces. Now, multiply the message matrix by matrix A (with matrix A on the right.)


Message: 7 15 0 21 14 20 0 5 1 7 12 5 19

\displaystyle \left[ \begin{array}{ccc} 7 & 15 & 0 \\ 21 & 14 & 20 \\ 0 & 5 & 1 \\ 7 & 12 & 5 \\ 19 & 0 & 0 \end{array} \right] \left[ \begin{array}{ccc}3 & 1 & 3 \\ 7 & 10 & -3 \\ 8 & 5 & 5 \end{array} \right]

This will result in your encoded message:

\displaystyle \left[ \begin{array}{ccc} 126 & 157 & -24 \\ 321 & 261 & 121 \\ 43 & 55 & -10 \\ 145 & 152 & 10 \\ 57 & 19 & 57 \end{array} \right]

Now have each student pass this encoded message to another student. Each student must use the inverse of matrix A to de-code the message!

Have them multiply this message matrix by B A^{-1} with the inverse on the right. They will get the de-coded Message matrix. From this they can discover the message!


green line


How has this topic appeared in pop culture (movies, TV, current music, video games, etc.)?

            Written as an engage:

We are going to begin with a short video today!

(Published on Feb 21, 2013)

This video introduces the Computer Graphics chapter of the “Computer Science Field Guide”, an online interactive “textbook” about computer science, written for high school students. The guide is free, and is available from cosc.canterbury.ac.nz/csfieldguide/ . This video may be downloaded if you need to play it offline.)


What did you notice about the movement of the objects in the video? Does this movement – rotation, position, size – remind you of anything you have done in math class before? What happened to the graph of a function when we multiplied the x value? What about when we multiplied the y value? What happened when we added or subtracted a number to x or y? Do these transformations of functions move in a similar manner as the computer graphics in the video? (Of course, the video shows three-dimensional movement while our graphs only showed two-dimensional movement.)

So what kind of transformations do you think are used to create computer graphics? The graphics you see in your video games, in the movies, on TV, in flight simulators for training pilots, and in many other applications are all created with the transformations of matrices. Matrix multiplication is used in computer graphics to size and scale objects as well as rotate and translate them. Today we are going to learn to compute a special matrix transformation – the inverse of a matrix!


green line

How can technology be used to effectively engage students with this topic?

            After the students have learned how to calculate the inverse of a 3 x 3 matrix by hand, you could tell them they are now going to calculate the inverse of a 4 x 4 matrix. After they all roll their eyes and groan, you can ask if they would rather do the calculations by hand or on their graphing calculators.

Now you can introduce a method for entering the data into a calculator (such as the TI83 or TI84.) Since many graphing calculators can handle large matrices, the matrix and the identity matrix can be entered together as a 4 x 8 matrix. By using the “rref(” application, the inverse matrix will automatically be calculated. Another way to calculate the inverse is to enter the matrix then press the x-1 key.

However, you may want to wait before teaching this “short-cut” method. You may choose to have the students enter the 4 x 8 (matrix and identity matrix) and show them how to do the row operations on the calculator. This is useful in helping them see the steps involved in the calculation (and tortures them just a little.)


Engaging students: Finding the asymptotes of a rational function

In my capstone class for future secondary math teachers, I ask my students to come up with ideas for engaging their students with different topics in the secondary mathematics curriculum. In other words, the point of the assignment was not to devise a full-blown lesson plan on this topic. Instead, I asked my students to think about three different ways of getting their students interested in the topic in the first place.

I plan to share some of the best of these ideas on this blog (after asking my students’ permission, of course).

This student submission again comes from my former student Belle Duran. Her topic, from Algebra: finding the asymptotes of a rational function.

green line

How has this topic appeared in high culture?

Although the topic itself has not appeared in high culture, idea of asymptotes brings me the idea of the myth of Tantalus. In a nutshell, Tantalus was always committing crimes against the Gods of Olympus but always going unpunished. One day, he invites the Gods to his home for a feast in which he serves the Gods a rather vile dish. This ultimately angered the Gods to the point of punishing Tantalus by hanging him from a fruit tree amidst a lake, sentencing him to suffer eternal hunger and thirst. Tantalus was always so close to the water and fruits, yet they stayed beyond his reach. In the same way, when a graph has an asymptote then a part of the graph will approach that asymptote without ever touching it or being equal to it.


green line

What interesting things can you say about the people who contributed to the discovery and/or the development of this topic?

The word, “asymptote” derives from the Greek word, “asumptotos” which translates to “not falling together.” The term was first introduced by Apollonius of Perga in his work on conic sections, but used the term to represent a line that will not meet the curve in any finite point. Other achievements by Apollonius includes the introduction of eccentric and epicyclic motion to explain the motion of the planets as well as the hemicyclium which is a sundial with hour lines drawn on the surface of a conic section to give greater accuracy.


green line

How does this topic be used in your students’ future courses in mathematics or science?

One way finding asymptotes can be used in students’ future courses are to understand finding the limits of a function. When it comes to limits, it can be shown that vertical asymptotes are concerned with objectives in which the function is not usually defined and near which the function becomes large positively or negatively, or if a line x=a is called a vertical asymptote for the graph of a function of either the limit to positive infinity as x approaches positive a or negative a. Likewise, horizontal asymptotes are concerned with finite values approached by the function as the independent variable grows large positively or negatively. In other words, a line y=b is a horizontal asymptote for the graph is either the limit of the function is b as x approaches positive infinity or negative infinity.

References

The myth of Tantalus

http://www-history.mcs.st-and.ac.uk/Biographies/Apollonius.html

http://jwilson.coe.uga.edu/emat6680/greene/emat6000/greek%20geom/Apollonius/apollonius.html

http://www.education.com/study-help/article/horizontal-vertical-asymptotes/

http://oregonstate.edu/instruct/mth251/cq/Stage3/Lesson/asymptotes.html


Lessons from teaching gifted elementary school students: Index

I’m doing something that I should have done a long time ago: collect past series of posts into a single, easy-to-reference post. The following posts formed my series on various lessons I’ve learned while trying to answer the questions posed by gifted elementary school students.

Part 1: A surprising pattern in some consecutive perfect squares.

Part 2: Calculating 2 to a very large exponent.

Part 3a: Calculating 2 to an even larger exponent.

Part 3b: An analysis of just how large this number actually is.

Part 4a: The chance of winning at BINGO in only four turns.

Part 4b: Pedagogical thoughts on one step of the calculation.

Part 4c: A complicated follow-up question.

The number of digits of n!: Index

I’m doing something that I should have done a long time ago: collect past series of posts into a single, easy-to-reference post. The following posts formed my series on computing the number of digits in n!.

Part 1: Introduction – my own childhood explorations.

Part 2: Why a power-law fit is inappropriate.

Part 3: The correct answer, using Stirling’s formula.

Part 4: An elementary derivation of the first three significant terms of Stirling’s formula.

Engaging students: Graphing with polar coordinates

In my capstone class for future secondary math teachers, I ask my students to come up with ideas for engaging their students with different topics in the secondary mathematics curriculum. In other words, the point of the assignment was not to devise a full-blown lesson plan on this topic. Instead, I asked my students to think about three different ways of getting their students interested in the topic in the first place.

I plan to share some of the best of these ideas on this blog (after asking my students’ permission, of course).

This student submission comes from my former student Laura Lozano. Her topic, from Precalculus: graphing with polar coordinates.


green line

How could you as a teacher create an activity or project that involves your topic?

An activity that I believe will go really well with graphing polar coordinates or any type of graphing lesson will be to convert the classroom floor into a graph. Also, I will have a selection of random objects like, a rubber ducky, boat, toy, etc. The size of the graph will depend on the size of classroom of course. If the classroom is really small then I would have to take this activity outdoors or maybe even the gym or anywhere with enough room for the graph and my students. The graph doesn’t have to be super big but I would use a graph no smaller than 8 feet by 8 feet area. I could create the graph lines with tape on the floor or draw them on big paper and tape the paper on the floor. I would start the activity with first talking about points on a Cartesian graph. An example could be to first have a students plot a couple points like (5, 4), (3, 6), or (-4, 2) on the board. Then transition them from Cartesian to polar coordinates by using the floor graph and have them discover how they relate by using the x and y coordinates to find the radius and the angle. Then later, after they get the hang of it, I would have the class split up into groups of two and let them choose an object, like a rubber ducky, boat, or toy, to set on the graph and have them write and tell me the point of their object.


green line

We see radars in the news almost all the time. One category that it is usually used in is weather. The weather center uses their radars to detect for any water particles, debris, and basically anything that is in the air that could be approaching. The way that they tell if a storm or any other weather change is coming is by the radar’s omitting radio waves. The radar omits waves that then come back to the radar if the waves clash with anything in the air. The radar can detect how far an object is by the time it takes for the wave to come back. It works just like an echo! Also, recently with the search of the Malaysian airplane, we saw it used more. The news will show a clip of aircraft radar or ship radar searching for something in the air or in the ocean. Radars look almost exactly like a polar graph does. On the left is a regular polar graph. On the right is a ship’s radar. Both graphs have angles with circles.

polar1

polar2


green line

How can technology (YouTube, Khan Academy [khanacademy.org], Vi Hart, Geometers Sketchpad, graphing calculators, etc.) be used to effectively engage students with this topic? Note: It’s not enough to say “such-and-such is a great website”; you need to explain in some detail why it’s a great website.

Graphing calculators can be used to discover polar coordinates and polar equations. I would first tell them to take out their calculators and just type in a random number from -10 to 10. I choose this interval because the graphing calculators have this window preset for graphing. I number that I randomly chose was the number 4. So I would go to the “Y=” button and type in 4. Then I would hit “GRAPH” and I should get a straight line horizontal line going through the y-axis at 4. I would then change the calculator mode and change from “FUNC” to “POL”. Then I would tell them to do the exact thing again with whatever number they chose. Once the hit “GRAPH” a circle should then come up. They then see how different polar graphs are from Cartesian graphs. Now, the graphs on a polar coordinate graph will all be circular instead of lines and curved lines like on the Cartesian graph.


Resources:

http://forecast.weather.gov/jetstream/doppler/how.htm

http://www.mi-net.ca/navigation.html