The following graph shows the number of digits in 

When I was in school, I stared at this graph for weeks, if not months, trying to figure out an equation that would fit these points. And I never could figure it out.
In retrospect, my biggest mistake was thinking that the formula had to be something like 

What I didn’t know then, but know now, is that there’s a really easy way to determine to determine if a data set exhibits power-law behavior. If

If we make the substitutions 


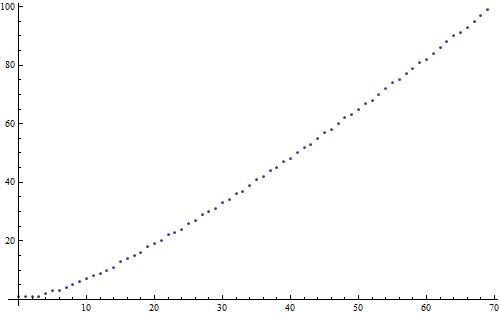
In other words, if the data exhibits power-law behavior, then the log-transformed data would look very much like a straight line. Well, here’s the graph of 

Ignoring the first couple of pots, the dots show an ever-so-slight concave down pattern, but not enough that would have discouraged me from blindly trying a pattern like

One thought on “The number of digits in n! (Part 2)”