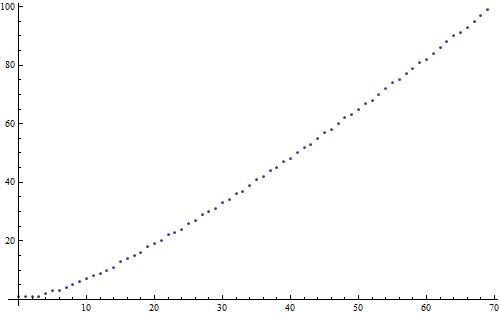
The following graph shows the number of digits in 

When I was in school, I stared at this graph for weeks, if not months, trying to figure out an equation that would fit these points. And I never could figure it out.
When I took calculus in college, I distinctly remember getting up the nerve to ask my professor, the great L.Craig Evans (now at UC Berkeley), if he knew how to solve this problem. To my great consternation, he immediately wrote down what I now realize to be the right answer, using Stirling’s approximation:

While I now know that this was the way to go about solving this problem, I didn’t appreciate how this formula could help me at the time. I only saw the
But now I know better.
For starters, the number of base-10 digits in a number 


Second, the change of base formula for logarithms gives

Therefore, the number of digits in

The graph below shows just how accurate this approximation really is. The solid curve is the approximation; the dots are the values of 


One thought on “The number of digits in n! (Part 3)”