Inverse Functions: Square Root (Part 6)

In this post, I take a deeper look at the standard mistake of “simplifying” \sqrt{x^2} incorrectly as just x.

In the previous post, we noted that the function f: \mathbb{R} \to \mathbb{R} defined by f(x) = x^2 fails the horizontal line test and thus does not have an inverse function.


squareroot1

However, we can restrict the domain of f to make a new function that does satisfy the horizontal line test. This new function is identical to f where both f and g are defined. Following tradition, we restrict the domain to [0,\infty):

g: [0,\infty) \to [0,\infty) defined by g(x) = x^2.

So by essentially erasing the left half of the parabola, we form a function that passes the horizontal line test which therefore has an inverse. Naturally, this function is g^{-1}(x) = \sqrt{x}. When I teach Precalculus, I like to write this as a sentence:

y = \sqrt{x} means that x = y^2 and y \ge 0.


squareroot3

Since g and g^{-1} are inverse functions, it’s always true that g(g^{-1}(x)) = x and g^{-1}(g(x)) = x whenever these functions are defined. For example,

g(g^{-1}(16)) = g(\sqrt{16}) = g(4) = 4^2 = 16 and

g^{-1}(g(3)) = g^{-1}(3^2) = g^{-1}(9) = \sqrt{9} = 3

In other words, we are guaranteed that g^{-1}(g(x)) = g^{-1}(x^2) = \sqrt{x^2} is always equal to x — as long x lies in the domain of g… or, in other words, as long as x is nonnegative.

Because if x is negative, all bets are off.

Remember, the original function f does not have an inverse. In particular, g^{-1} and f are not inverse functions, and so it’s possible for g^{-1}(f(x)) to be something other than x. For example,

g^{-1}(f(3)) = \sqrt{3^2} = \sqrt{9} = 3, but

g^{-1}(f(-3)) = \sqrt{(-3)^2} = \sqrt{9} = 3 \ne -3

Of course, I don’t expect my Precalculus students to remember the subtle reason that this fails when they do their homework problems. But I do tell my Precalculus students that the nontrivial simplification of \sqrt{x^2} is a natural consequence of restricting the domain of a function that does not pass the horizontal line test to define an inverse function. In this example, \sqrt{x^2} = x as long as x \ge 0. However, if x < 0, then the result really could be just about anything else. For the current example, we have the pairwise simplification

\sqrt{x^2} = x if x \ge 0;

\sqrt{x^2} = -x if x < 0.

The last line is often uncomfortable for students, and so I remind them that x is assumed to be negative so that -x is positive. Of course, there’s a new notation that mathematicians have developed so that this two-line simplification of \sqrt{x^2} can be compressed to a single line:

\sqrt{x^2} = |x|

Unfortunately, in my opinion, this remains the problem that can be stated in two seconds or less (“Simplify the square root of x squared”) that, in my opinion, is missed most often by mathematics students.

Inverse Functions: Restricted Domain for Square Root (Part 5)

With the last four posts as prelude, let’s consider finding the inverse of the function f: \mathbb{R} \to \mathbb{R} defined by f(x) = x^2.


squareroot1

Of course, we can’t find an inverse for this function as stated. Colloquially, the graph of f fails the horizontal line test. More precisely, there exist two numbers x_1 and x_2 so that x_1 \ne x_2 but f(x_1) = f(x_2). (Indeed, there are infinitely many such pairs — a and -a for any a \ne 0 — but that’s beside the point.)

So how will we find the inverse of f? Well, we can’t. But we can do something almost as good: we can define a new function g that’s going look an awful lot like f. Here’s the function:

g: [0,\infty) \to [0,\infty) defined by g(x) = x^2.

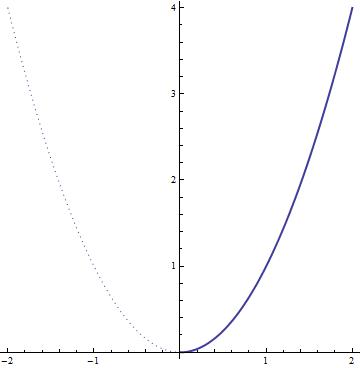
Notice that the function g looks an awful lot like f, except that the domain has been restricted. In this way, the left half of the graph of f is essentially erased to produce the graph of g.

squareroot2

So while the graph of f fails the horizontal line test, the graph of g does pass the horizontal line test. Therefore, g has an inverse function. We reverse the roles of domain and range (of course, for this example, the domain and range are identical):

g^{-1}: [0,\infty) \to [0,\infty)

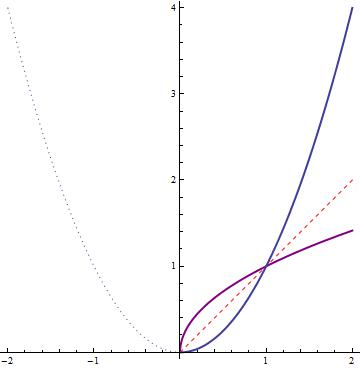
Also, the graph of g^{-1} can be produced by reflecting through the line y=x, producing the purple graph below.

squareroot3

Of course, the function g^{-1}(x) is more customarily written as \sqrt{x}. Stated another way using the restricted domain of g.

y = \sqrt{x} means that x = y^2 and y \ge 0.

Pedagogically, when teaching Precalculus, I’ve found that this way of writing the definition of \sqrt{x} is a useful prelude to the definition of the inverse trigonometric functions.

A couple of notes:

  1. Notice that, if the purple parabola was completed, the full parabola would violate the vertical line test and thus fail to be a function. Thinking back to the original function, that’s another way of saying that the original full parabola violates the horizontal line test.
  2. Since g and g^{-1} are inverse functions, it’s always true that g(g^{-1}(x)) = x and g^{-1}(g(x)) = x. However, g^{-1} and f are not inverse functions, and so it’s possible for g^{-1}(f(x)) to be something other than x. This subtle distinction will be discussed more in tomorrow’s post.
  3. Restricting the domain to [0,\infty) was a perfectly arbitrary decision. It would have been perfectly OK if we have chosen the left half of the original parabola instead of the right half, as either half of the parabola satisfies the horizontal line test. So why did we choose the right half (with the nonnegative domain) instead of the left half (with the nonpositive domain)? That I can answer with one word: tradition. (By the way, finding an expression for the restriction of f to (-\infty,0]) is a standard problem in a first course in real analysis.

Inverse Functions: Solving Equations (Part 4)

Although disguised, inverse functions play an important role in the ordinary solution of equations. For example, consider the steps used to solve this simple algebra problem:

2x + 4 = 10

2x = 6

x = 3

To go from the first equation to the second equation, let X_1 = 2x+4 and X_2 = 10, and let $f(x) = x – 4$. This is an bijective function with inverse f^{-1}(x) = x +4. Therefore,

X_1 = X_2 \quad \Longleftrightarrow \quad f(X_1) = f(X_2)

Stated another way,

2x + 4 = 10 \quad \Longleftrightarrow 2x = 6

Again, let $X_3 = 2x$ and $X_4 = 6$, and let $g(x) = x/2$. This is also a bijective function with inverse function $g^{-1}(x) = 2x$. Therefore,

X_3= X_4 \quad \Longleftrightarrow \quad g(X_1) = g(X_2)

Stated another way,

$latex 2x + 4 = 10 \quad \Longleftrightarrow 2x = 6 \quad \Longleftrightarrow x = 3$

So we are guaranteed that x= 3 is the one and only one solution of this equation.

green lineIf the process of solving an equation requires the use of a function that isn’t a bijection, then funny things can happen. For example, consider the slightly more complicated equation

\sqrt{x} = x - 6

Let’s starting solving by squaring both sides:

x = (x-6)^2

x = x^2 - 12x + 36

0 = x^2 - 13x + 36

0 = (x-9)(x-4)

x - 9 = 0 \quad \hbox{or} \quad x - 4 = 0

x = 9 \quad \hbox{or} \quad x = 4

So there are two solutions, right? Well…

\sqrt{9} = 3 = 9 - 6,

but \sqrt{4} \ne 4 - 6!

So what happened? In other words, what is qualitatively different about this problem that didn’t happen in the first problem to produce an extraneous solution? The problem is the first step. Let X_1 = \sqrt{x} and X_2 = x-6. We applied the function f(x) = x^2 to both sides. Unfortuntely, f(x) = x^2 is not an invertible function when using the entire real line as the domain of f. In other words,

\sqrt{x} = x -6 \quad implies \quad x = (x-6)^2,

but x =(x-6)^2 \quad does not imply that \quad \sqrt{x} = x - 6.

 The practical upshot is that, when arriving at the final step of the solution, we can’t be certain that the “solutions” we obtain actually work. Instead, what we’ve really shown that anything other than the solutions can’t work, which is different than saying that these two solutions actually do work. So it remains to actually check that these potential solutions are actually solutions (or not).

Inverse Functions: Definition and Horizontal Line Test (Part 3)

From MathWorld, a function f: A \to B  is an object f such that every a \in A is uniquely associated with an object f(a) \in B. Stated more pedantically, if a_1, a_2 \in A and a_1 = a_2, then f(a_1) = f(a_2). More colloquially, in the graphs that ordinarily appear in secondary school, every x-coordinate of the graph is associated with a unique y-coordinate.

For this reason, the figure below (taken from http://en.wikipedia.org/wiki/Vertical_line_test) is not a function. The three points share a common x-coordinate but have different y-coordinates. In school, we usually teach students to distinguish functions from non-functions by the Vertical Line Test.

It is possible for a function to be a function but not have an inverse. Also from MathWorld, a function f is said to be an injection (or, in the lingo that I learned as a student, one-to-one) if, whenever f(x_1) = f(x_2), it must be the case that x_1=x_2. Equivalently, x_1 \ne x_2 implies f(x_1) \ne f(x_2).  In other words, f is an injection if it maps distinct objects to distinct objects.

The following image (taken from http://en.wikipedia.org/wiki/Horizontal_line_test) illustrates a function that is not injective (or, more accurately, is not injective when using all of the function’s domain). The horizontal line intersects the graph of the function at three distinct points with three different x-intercepts which are associated with the same y-coordinate.


By ensuring that the range of f is restricted to the values that are actually attained by f, the function f may be considered as bijective and hence has an inverse function. The inverse function f^{-1} is logically defined as

f^{-1}(y) = x \quad \Longleftrightarrow \quad f(x) = y

In this way, f^{-1}(f(x)) = x and f \left( f^{-1}(y) \right) = y for all x in the domain of f and all y in the range of f. Becaise (x,y) is on the graph of f if and only if (y,x) is on the graph of f^{-1}, the graph of f^{-1} may be obtained by reflecting the graph of y = f(x) through the line y = x. Stated another way, to ensure that f^{-1} is a function that satisfies the horizontal line test, it must be the case (when looking at the reflection through y= x that the original function satisfies the horizontal line test.

Inverse functions: Square root (Part 2)

Here is one of the questions that I ask my class of future secondary mathematics teachers to answer.

A student asks, “My father was helping me with my homework last night and he said the book is wrong. He said that \sqrt{4} = 2 and \sqrt{4} = -2, because 2^2 = 4 and (-2)^2 = 4. But the book says \sqrt{4} = 2. He wants to know why we are using a book that has mistakes.”

This is a very similar question to the simplification of \sqrt{x^2}, which was discussed in yesterday’s post. My experience has been that the above misconceptions involves confusion surrounding two very similar-sounding questions.

Question #1: Find all values of x so that x^2 = 9.

Question #2: Find the nonnegative value of x so that x^2 = 9.

The first question can be restated as solving x^2-9 = 0, or finding all roots of a second-order polynomial. Accordingly, there are two answers. (Of course, the answers are 3 and -3, written more succinctly as \pm 3.) The second question asks for the positive answer to Question #1. This positive answer is defined to be \sqrt{9}, or 3.

In other words, it’s important to be sure that you’re answering the right question.

Is it all that important that \sqrt{9} is chosen to be the nonnegative solution to Question #1? Not really. We could have easily chosen the negative answer. The reason we choose the positive answer and not the negative answer can be answered in one word: tradition.

We want f(x) = \sqrt{x} to be a well-defined function that produces only one output value, and there’s no mathematically advantageous reason for choosing the nonnegative answer aside from the important consideration that everyone else does it that way. And though students probably won’t remember this tidbit of wisdom when the time comes, the same logic applies when choosing the range of the inverse trigonometric functions.

Of course, for the present case, it totally makes sense to take the positive, less complicated answer as the output of \sqrt{x}. However, this won’t be as readily apparent when we consider the inverse trigonometric functions.

Inverse functions: Square root (Part 1)

What is the math question that can be stated in two seconds but is most often answered incorrectly by math majors? In my opinion, here it is:

Simplify \sqrt{x^2}.

In my normal conversational voice, I can say “Simplify the square root of x squared” in a shade less than two seconds.

Here’s a thought bubble if you’d like to think about this before I give the answer.

green_speech_bubble

A common mistake made by algebra students (and also math majors in college who haven’t thought about this nuance for a while) is thinking that \sqrt{x^2} = x. This is clearly incorrect if x is negative:

\sqrt{(-3)^2} = \sqrt{9} = 3 \ne -3

The second follow-up mistake is then often mistake made by attempting to rectify the first mistake by writing \sqrt{x^2} = \pm x. The student usually intends the symbol \pm to mean “plus or minus, depending on the value of x,” whereas the true meaning is “plus or minus” without any caveats. I usually correct this second mistake by pointing out that when a student finds \sqrt{9} with a calculator, the calculator doesn’t flash between 3 and -3; it returns only one answer.

After clearing that conceptual hurdle, students can usually guess the correct simplification:

\sqrt{x^2} = |x|

green lineIn this series of posts, I’d like to expand on the thoughts above to consider some of the inverse functions that commonly appear in secondary mathematics: the square-root function and the inverse trigonometric functions.

Engaging students: Graphing an ellipse

In my capstone class for future secondary math teachers, I ask my students to come up with ideas for engaging their students with different topics in the secondary mathematics curriculum. In other words, the point of the assignment was not to devise a full-blown lesson plan on this topic. Instead, I asked my students to think about three different ways of getting their students interested in the topic in the first place.

I plan to share some of the best of these ideas on this blog (after asking my students’ permission, of course).

This student submission comes from my former student Samantha Smith. Her topic, from Precalculus: graphing an ellipse.

green line

How has this topic appeared in pop culture?

Football is America’s favorite sport. There is practically a holiday for it: Super Bowl Sunday. I do not think students realize how much math is actually involved in the game of football, from statistics, to yards, the stadium and even the football itself. The video link below explores the shape of the football and of what importance the shape is. As you can see in the picture below, a 2D look of the football shows us that it is in the shape of an ellipse.


The video further explains how the 3D shape (Prolate Spheroid) spins in the air and is aerodynamic. Also, since it is not spherical, it is very unpredictable when it hits the ground. The football can easily change directions at a moments notice. This video is a really cool introduction to graphing an ellipse; it shows what the shape does in the real world. Students could even figure out a graph to represent a football. Overall, this is just a way to engage students in something that they are interested in.

football

https://www.nbclearn.com/nfl/cuecard/50824 (Geometric Shapes –Spheres, Ellipses, & Prolate Speroids)


green line

D. History: What interesting things can you say about the people who contributed to the discovery and/or development of this topic?

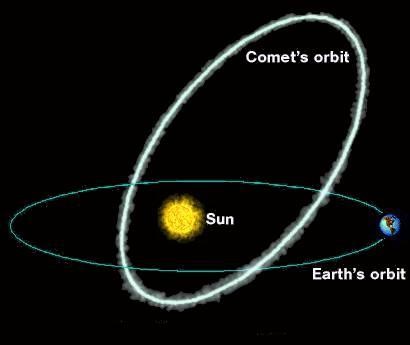
Halley’s Comet has been observed since at least 240 B.C. It could be labeled as the most well-known comet. The comet is named after one of Isaac Newton’ friends, Edmond Halley. Halley worked closely with Newton and used Newton’s laws to calculate how gravitational fields effected comets. Up until this point in history, it was believed that comets traveled in a straight path, passing the Earth only once. Halley discovered that a comet observed in 1682 followed the same path as a comet observed in 1607 and 1531. He predicted the comet would return in 76 years, and it did. Halley’s Comet was last seen in 1986 so, according to Halley’s calculations, it will reappear in 2061.
Halley’s Comet has an elliptical orbit around the sun. It gets as close to the sun as the Earth and as far away from the sun as Pluto. This is an example of how ellipses appear in nature. We could also look at the elliptical orbits of the different planets around the sun. Students have grown up hearing about Newton’s Laws, but this is an actual event that supported and developed those laws in relation to ellipses.

What is Halley’s Comet?

halley


green line

How has this topic appeared in high culture?

whisperinggallery

Through my research on ellipses, the coolest application I found is Statuary Hall (the Whispering Gallery) in our nation’s capital. The Hall was constructed in the shape of an ellipse. It is said that if you stand at one focal point of the ellipse, you can hear someone whispering across the room at the other focal point because of the acoustical properties of the elliptical shape. The YouTube video below illustrates this phenomena. The gallery used to be a meeting place of the House of Representatives. According to legend, it was John Quincy Adams that discovered the room’s sound properties. He placed his desk at a focus so he could easily hear conversations across the room.

The first link below is a problem students can work out after transitioning from the story of the hall. Given the dimensions of the room, students find the equation of the ellipse that models the room, the foci of the ellipse, and the area of the ellipse. This one topic can cover multiple applications of the elliptical form of Statuary Hall.

Click to access PreAP-PreCal-Log-6.3.pdf

http://www.pleacher.com/mp/mlessons/calculus/appellip.html

Engaging students: Graphing a hyperbola

In my capstone class for future secondary math teachers, I ask my students to come up with ideas for engaging their students with different topics in the secondary mathematics curriculum. In other words, the point of the assignment was not to devise a full-blown lesson plan on this topic. Instead, I asked my students to think about three different ways of getting their students interested in the topic in the first place.

I plan to share some of the best of these ideas on this blog (after asking my students’ permission, of course).

This student submission comes from my former student Rebekah Bennett. Her topic, from Precalculus: graphing a hyperbola.

green line

Hyperbolas are one of the hardest things to find within the real world. Relating to students, the hyperbola is popularly known as the Hurley symbol; A widely known surf symbol that is now branded on clothes and surf boards. It is also used widely in designs to create patterns on large carpets or flooring. They can also be used when building houses to make sure that a curve on the exterior or interior of the house is mirrored exactly how the buyer wants. Hyperbolas can be found when building graphics for games such as the game roller coaster tycoon. This is a game where several different graphics must be formed so that any type of roller coaster can be created. Also, when playing the wii or xbox Kinect, hyperbolas are used within the design of the system. Since both game systems are based on movement and there are several different types of ways someone can move, the system must have these resources available so that it can read what the person in doing. Hyperbolas are commonly found everywhere with some type of design.


green line

To explore this topic, I would first show the students this video of the roller coaster “Fire and Ice” which is in Orlando, Florida at Universal Studios. This roller coaster was created so that when the two roller coasters go around a loop at the same time, they will never hit, making for a fun, adventurous time. This is what a hyperbola simply is; every point lies within the same ratio from focus to directrix. During the video point out the hyperbolic part of the roller coaster which is shown at the 49-51 second mark.


Now after watching the video, the students would be given about 8 minutes to explore by themselves or with a partner, how to create their own hyperbola. The student can use any resources he/she would like. Once the students have had enough time to explore, the teacher would then have the student watch an instructional video from Kahn Academy.


The video is very useful in teaching students how to graph a hyperbola because the instructor goes through step by step carefully explaining what each part means and why each part is placed where it is in the function. The video is engaging to the students since they don’t have to listen to their teacher say it a million times and then reinforce it. This is also helpful for the teacher because the student hears it from one source and then it is reinforced by the teacher, giving the teacher a second hand because it’s now coming from two sources not just one.


After the video, the students can now split up into groups of at least 3 and create their own “Fire and Ice” roller coaster from scratch. They will have the information from the video to help them know how to create the function and may also ask questions. The student may create their hyperbola roller coaster anyway they would like, using any directrix as well. But keep in mind that you would probably want to tell them it needs to be somewhat realistic or else you could get some crazy ideas. Once all the groups are finished, they will present their roller coaster to the class and be graded by their peers for one grade and then graded by the teacher for participation and correctness.


green lineFrom previous math courses, the student should already know the terms slope and vertex. The student should’ve already learned how to graph a parabola. Everything that a student uses to graph a parabola is used to graph a hyperbola but yet with more information. Starting from the bottom, a parabola is used because all a hyperbola technically is, is the graph show a parabola and its mirrored image at the same time. From here the student learns about the directrix, which is the axis of symmetry that the parabola follows. The student will now be able to learn about asymptotes which are basically what a directrix is in a hyperbola function. This opens the door to several graphs of limits that the student will learn throughout calculus and higher math classes.


Engaging students: Using right-triangle trigonometry

In my capstone class for future secondary math teachers, I ask my students to come up with ideas for engaging their students with different topics in the secondary mathematics curriculum. In other words, the point of the assignment was not to devise a full-blown lesson plan on this topic. Instead, I asked my students to think about three different ways of getting their students interested in the topic in the first place.

I plan to share some of the best of these ideas on this blog (after asking my students’ permission, of course).

This student submission comes from my former student Shama Surani. Her topic, from Precalculus: using right-triangle trigonometry.

green line

How could you as a teacher create an activity or project that involves your topic?
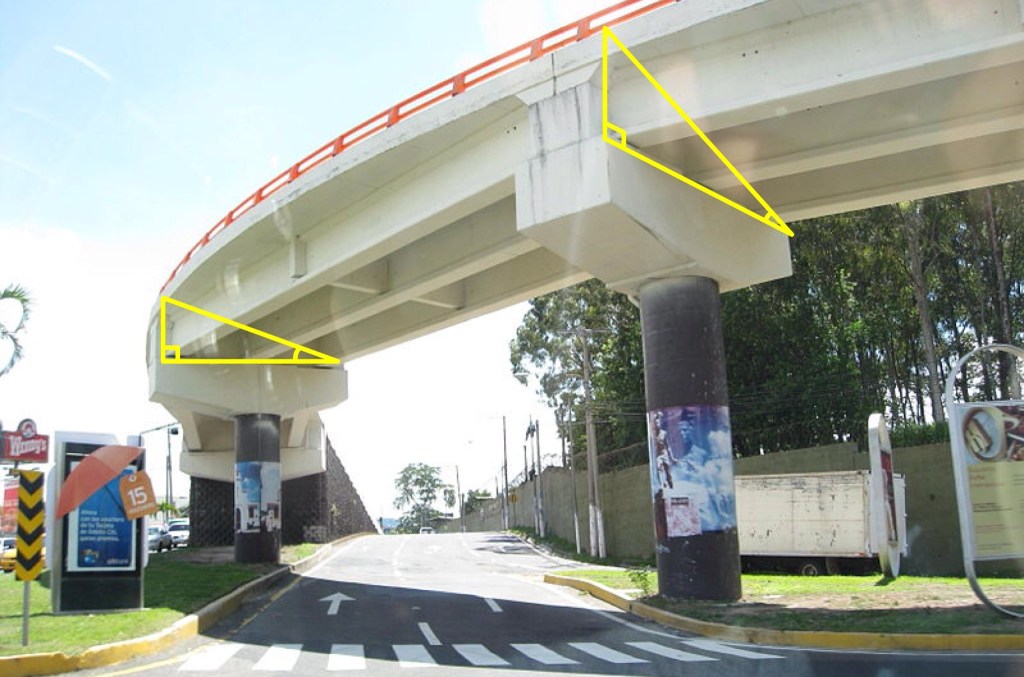
bridge

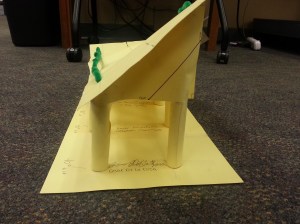
A project that Dorathy Scrudder, Sam Smith, and I did that involves right-triangle trigonometry in our PBI class last week, was to have the students to build bridges. Our driving question was “How can we redesign the bridge connecting I-35 and 635?” The students knew that the hypotenuse would be 34 feet, because there were two lanes, twelve feet each, and a shoulder of ten feet that we provided on a worksheet. As a group, they needed to decide on three to four angles between 10-45 degrees, and calculate the sine and cosine of the angle they chose. One particular group used the angle measures of 10°, 20°, 30°, and 40°. They all calculated the sine of their angles to find the height of the triangle, and used cosine to find the width of their triangle by using 34 as their hypotenuse. The picture above is by Sam Smith, and it illustrates the triangles that we wanted the students to calculate.


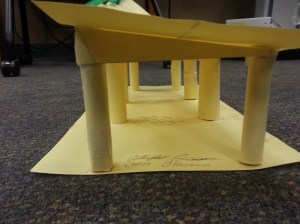
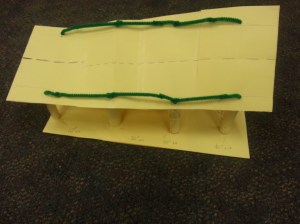
The students were instructed to make a scale model of a bridge so they were told that 1 feet = 0.5 centimeters. Hence, the students had to divide all their calculations by two. Then, the students had to check their measurements of their group members, and were provided materials such as cardstock, scissors, pipe cleaners, tape, rulers, and protractors in order to construct their bridges.  They had to use a ruler to measure out what they found for sine and cosine on the cardstock, and make sure when they connected the line to make the hypotenuse that the hypotenuse had a length of 17 centimeters. After they drew their triangles, they had to use a protractor to verify that the angle they chose is what one of the angles were in the triangle. When our students presented, they were able to communicate what sine and cosine represented, and grasped the concepts.

Below are pictures of the triangles and bridges that one of our groups of students constructed. Overall, the students enjoyed this project, and with some tweaks, I believe this will be an engaging project for right triangle trigonometry.
studentbridge3 studentbridge2 studentbridge1

green line

How does this topic extend what your students should have learned in previous courses?


In previous classes, such in geometry, students should have learned about similar and congruent triangles in addition to triangle congruence such as side-side-side and side-angle-side. They should also have learned if they have a right angle triangle, and they are given two sides, they can find the other side by using the Pythagorean Theorem. The students should also have been exposed to special right triangles such as the 45°-45°-90° triangles and 30°-60°-90° triangles and the relationships to the sides. Right triangle trigonometry extends the ideas of these previous classes. Students know that there must be a 45°-45°-90° triangle has side lengths of 1, 1, and \sqrt{2} which the lengths of 1 subtending the 45° angles. They also are aware that a 30°-60°-90° produces side lengths of 1, \sqrt{3} , and 2, with the side length of 1 subtending the 30°, the length of \sqrt{3} subtending the angle of 60°, and the length of 2 subtending the right angle. So, what happens when there is a right angle triangle, but the other two angles are not 45 degrees or 30 and 60 degrees? This is where right triangle trigonometry comes into play. Students will now be able to calculate the sine, cosine, and tangent and its reciprocal functions for those triangles that are right. Later, this topic will be extended to the unit circle and graphing the trigonometric functions as well as their reciprocal functions and inverse functions.


green line

What are the contributions of various cultures to this topic?


Below are brief descriptions of various cultures that personally interested me.


Early Trigonometry


The Babylonians and Egyptians studied the sides of triangles other than angle measure since the concept of angle measure was not yet discovered. The Babylonian astronomers had detailed records on the rising and setting of stars, the motion of planets, and the solar and lunar eclipses.   On the other hand, Egyptians used a primitive form of trigonometry in order to build the pyramids.


Greek Mathematics


Hipparchus of Nicaea, now known as the father of Trigonometry, compiled the first trigonometric table. He was the first one to formulate the corresponding values of arc and chord for a series of angles. Claudius Ptolemy wrote Almagest, which expanded on the ideas of Hipparchus’ ideas of chords in a circle. The Almagest is about astronomy, and astronomy relies heavily on trigonometry.


Indian Mathematics


Influential works called Siddhantas from the 4th-5th centry, first defined sine as the modern relationship between half an angle and half a chord. It also defined cosine, versine (which is 1 – cosine), and inverse sine. Aryabhata, an Indian astronomer and mathematician, expanded on the ideas of Siddhantas in another important work known as Aryabhatiya. Both of these works contain the earliest surviving tables of sine and versine values from 0 to 90 degrees, accurate to 4 decimal places. Interestingly enough, the words jya was for sine and kojya for cosine. It is now known as sine and cosine due to a mistranslation.


Islamic Mathematics


Muhammad ibn Mūsā al-Khwārizmī had produced accurate sine and cosine tables in the 9th century AD. Habash al-Hasib al-Marwazi was the first to produce the table of cotangents in 830 AD. Similarly, Muhammad ibn Jābir al-Harrānī al-Battānī had discovered the reciprocal functions of secant and cosecant. He also produced the first table of cosecants.


Muslim mathematicians were using all six trigonometric functions by the 10th century.  In fact, they developed the method of triangulation which helped out with geography and surveying.


Chinese Mathematics


In China, early forms of trigonometry were not as widely appreciated as it was with the Greeks, Indians, and Muslims. However, Chinese mathematicians needed spherical geometry for calendrical science and astronomical calculations. Guo Shoujing improved the calendar system and Chinese astronomy by using spherical trigonometry in his calculations.


European Mathematics


Regiomontanus treated trigonometry as a distinct mathematical discipline. A student of Copernicus, Georg Joachim Rheticus, was the first one to define all six trigonometric functions in terms of right triangles other than circles in Opus palatinum de triangulis. Valentin Otho finished his work in 1596.


http://en.wikipedia.org/wiki/History_of_trigonometry