Solving a Math Competition Problem: Part 6

This series of posts concerns solving the following problem from the 2016 University of Maryland High School Mathematics Competition.

A sphere is divided into regions by 9 planes that are passing through its center. What is the largest possible number of regions that are created on its surface?

a. 2^8

b. 2^9

c. 81

d. 76

e. 74

This series was actually written by my friend Jeff Cagle, department head for mathematics at Chapelgate Christian Academy, as he tried technique after technique to solve this problem. I thought that his resolution to the problem was an excellent example of the process of mathematical problem-solving, and (with his permission) I am posting the process of his solution here. (For the record, I have no doubt that I would not have been able to solve this problem.)

OK, so I wanted to prove that each region would be a triangle. So I decided to project the sphere onto a plane.

The projection of four planes:

After a while, I had a chart for max possible regions.

  • 1 plane: Max regions = 2
  • 2 planes: Max regions = 4
  • 3 planes: Max regions = 8 (exponential?)
  • 4 planes: Max regions = 14 (nope!)
  • 5 planes: Max regions = 22 (huh?)

Solving a Math Competition Problem: Part 5

This series of posts concerns solving the following problem from the 2016 University of Maryland High School Mathematics Competition.

A sphere is divided into regions by 9 planes that are passing through its center. What is the largest possible number of regions that are created on its surface?

a. 2^8

b. 2^9

c. 81

d. 76

e. 74

This series was actually written by my friend Jeff Cagle, department head for mathematics at Chapelgate Christian Academy, as he tried technique after technique to solve this problem. I thought that his resolution to the problem was an excellent example of the process of mathematical problem-solving, and (with his permission) I am posting the process of his solution here. (For the record, I have no doubt that I would not have been able to solve this problem.)

OK, so I wanted to prove that each region would be a triangle. So I decided to project the sphere onto a plane.

For a while, I toyed with the situation where we have

  • Plane 1 โ€“ equator (this always happens: Just make plane 1 the equator) ๐‘ƒ1(0๐‘, 0๐ธ).
  • Plane 2 โ€“ Prime Meridian ๐‘ƒ2(90๐‘, 0๐ธ)
  • Plane 3 โ€“ Intl Date Line ๐‘ƒ3(90๐‘, 90๐ธ)
  • Plane 4 โ€“ at an angle to all of those ๐‘ƒ4(45๐‘, 45๐ธ)

Here is our mapping with P1, P2, and P3 on it:

Now, how to represent P4? Aha! The inside of the unit circle is the southern hemisphere, and the outside is the northern. P4 must hit the equator a two points 180 degrees apart, go inside the southern hemisphere, and then outside to the northern. Thus:

The white region is a NONtriangular region created by the intersection of four planes. These are strange-looking regions, and I spent a long time โ€“ several days โ€“ vainly trying to count max regions created when I added P5, P6 etc. But one thing was clear: not all of the regions are triangular, nor can they be. For if a plane (say P4) cuts through a triangular region, it will create a new triangular region and a non-triangular โ€œquadrilateralโ€, as in the figure below. So counting triangles from points is NOT the solution here!

Solving a Math Competition Problem: Part 4

This series of posts concerns solving the following problem from the 2016 University of Maryland High School Mathematics Competition.

A sphere is divided into regions by 9 planes that are passing through its center. What is the largest possible number of regions that are created on its surface?

a. 2^8

b. 2^9

c. 81

d. 76

e. 74

This series was actually written by my friend Jeff Cagle, department head for mathematics at Chapelgate Christian Academy, as he tried technique after technique to solve this problem. I thought that his resolution to the problem was an excellent example of the process of mathematical problem-solving, and (with his permission) I am posting the process of his solution here. (For the record, I have no doubt that I would not have been able to solve this problem.)

OK, so I wanted to prove that each region would be a triangle. So I decided to project the sphere onto a plane. Thereโ€™s a standard way of doing that, used both by map-makers and mathematicians. Place the sphere with the south pole on the plane at the origin. Then for each point on the sphere, run a line from the north pole through that point to the plane. This gives a 1-1 mapping of sphere to plane. The diagram below shows this mapping, with the points A and B on the sphere mapping to the points Aโ€™ and Bโ€™ on the plane respectively.

Notice that in the mapping above, the south pole is mapped to the origin (โ€œstraight downโ€), while the north pole itself cannot be mapped. We call the north point the โ€œpoint at infinity.โ€ Also notice that the equator gets mapped to a circle. And, any circle around the sphere that goes through the north pole will also go through the south pole, and so becomes a line in the plane.


Solving a Math Competition Problem: Part 3

This series of posts concerns solving the following problem from the 2016 University of Maryland High School Mathematics Competition.

A sphere is divided into regions by 9 planes that are passing through its center. What is the largest possible number of regions that are created on its surface?

a. 2^8

b. 2^9

c. 81

d. 76

e. 74

This series was actually written by my friend Jeff Cagle, department head for mathematics at Chapelgate Christian Academy, as he tried technique after technique to solve this problem. I thought that his resolution to the problem was an excellent example of the process of mathematical problem-solving, and (with his permission) I am posting the process of his solution here. (For the record, I have no doubt that I would not have been able to solve this problem.)

AHH! Insight! Each plane must intersect the others because they all pass through the center. And two planes intersect in a line. And the line must intersect the sphere at two points. SO, we can count intersection points: There are 9 planes, and each plane will intersect the other 8, so there are 9 โˆ— 8 = 72 intersection points IF we arrange the planes for maximum regions. More generally, if we have n planes arranged for max intersection points, we will have ๐‘›(๐‘› โˆ’ 1) intersection points.
Wait, letโ€™s do this carefully. There are 9 planes, and they can each intersect 8 different planes; but that counts the intersections of plane A and plane B twice, so there are (9*8)/2 = 36 lines of intersection, but 36 โˆ— 2 = 72 points of intersection with the sphere. So our problem just got narrower: Given 72 intersection points defining various regions on the sphere, how many regions do we get?
And thatโ€™s where the problem stands as of this writing. My preliminary conjecture is that each region will be a โ€œtriangleโ€ (officially, spherical triangle) on the surface of the sphere, especially if we are maximizing regions. I need to prove that conjecture and then count triangles, which shouldnโ€™t be too hard.

Solving a Math Competition Problem: Part 2

This series of posts concerns solving the following problem from the 2016 University of Maryland High School Mathematics Competition.

A sphere is divided into regions by 9 planes that are passing through its center. What is the largest possible number of regions that are created on its surface?

a. 2^8

b. 2^9

c. 81

d. 76

e. 74

This series was actually written by my friend Jeff Cagle, department head for mathematics at Chapelgate Christian Academy, as he tried technique after technique to solve this problem. I thought that his resolution to the problem was an excellent example of the process of mathematical problem-solving, and (with his permission) I am posting the process of his solution here. (For the record, I have no doubt that I would not have been able to solve this problem.)

At this point, various methods suggested themselves. Perhaps we could use recursion: let N_n be the regions created by n planes, and then we could examine the number of additional regions formed by n+1 planes?

Or, related to this, perhaps we needed to find the number of intersection points of each of the planes, and then relate the number of intersection points to the number of regions. But how to describe the intersection points?

It did occur to me that if we have n planes situated for maximal regions, they will divide the equator up into 2n subintervals, and adding another plane will divide up two of those subintervals into 4. Did that help? Well, it could help count the number of regions touching the equator: two for each subinterval (one north of equator, one south). But what about the regions not touching the equator? Hmph.

One possible way to visualize this problem is to project the plane onto a sphere. I know how to
do that, but counting the regions still seems hard.

For a while, I toyed with the situation where we have

  • Plane 1 โ€“ equator (this always happens: Just make plane 1 the equator) ๐‘ƒ1(0๐‘, 0๐ธ).
  • Plane 2 โ€“ Prime Meridian ๐‘ƒ2(90๐‘, 0๐ธ)
  • Plane 3 โ€“ Intl Date Line ๐‘ƒ3(90๐‘, 90๐ธ)
  • Plane 4 โ€“ at an angle to all of those ๐‘ƒ4(45๐‘, 45๐ธ)

I looked at my daughterโ€™s wall map of the world: P4 goes through Tblisi Georgia and south of French Polynesia.

Where does P4 intersect the others? Could I make a formula to find the intersection points?


Solving a Math Competition Problem: Part 1

This series of posts concerns solving the following problem from the 2016 University of Maryland High School Mathematics Competition.

A sphere is divided into regions by 9 planes that are passing through its center. What is the largest possible number of regions that are created on its surface?

a. 2^8

b. 2^9

c. 81

d. 76

e. 74

This series was actually written by my friend Jeff Cagle, department head for mathematics at Chapelgate Christian Academy, as he tried technique after technique to solve this problem. I thought that his resolution to the problem was an excellent example of the process of mathematical problem-solving, and (with his permission) I am posting the process of his solution here. (For the record, I have no doubt that I would not have been able to solve this problem.)

On my first pass, all I could do was to visualize the first three planes, one at the equator, one passing through the prime meridian in Greenwich England, and one passing through the International Date Line. That gave me 2^3=8 regions, so my preliminary conjecture was โ€œb. 2^9โ€. But I couldnโ€™t prove it. And when I tried to mentally add a fourth plane to my diagram โ€“ one starting in Ukraine or something and hitting the equator halfway between the others โ€“ I found that I couldnโ€™t clearly see that plane and count the regions formed. That vexed me for a while, and I put it away for the day.

The next day, I realized that I wasnโ€™t going to be able to picture these planes, and I needed to find a way to describe their directions mathematically. The picture I had was of the equatorial plane and a second plane passing through it in the center. That second plane could be rotated any amount around the equator โ€“ described by one angle โ€“ and then elevated by tilting to a different angle. So I conjectured that two angles uniquely describe each plane: ๐œƒ to describe angle around and ๐œ™ to describe angle of elevation.

In the shower, I realized that I had just rediscovered latitude and longitude! That made me feel much better about my mathematical description as likely correct.

But now, how to turn the mathematical description into a solution? If I have one plane at (๐œƒ1,๐œ™1), how do I count the regions it creates with the other planes?

Engaging students: Geometric sequences

In my capstone class for future secondary math teachers, I ask my students to come up with ideas for engaging their students with different topics in the secondary mathematics curriculum. In other words, the point of the assignment was not to devise a full-blown lesson plan on this topic. Instead, I asked my students to think about three different ways of getting their students interested in the topic in the first place.

I plan to share some of the best of these ideas on this blog (after asking my students’ permission, of course).

This student submission comes from my former student Zachery Hasegawa. His topic, from Precalculus: geometric sequences.

green line

How has this topic appeared in pop culture? (movies, TV, current music, video games, etc.)

Geometric sequences appear frequently in pop culture.ย  One example that immediately comes to mind is the movie The Happening starring Mark Wahlberg and Zoe Deschanel.ย  In the movie, there is a scene where a gentleman is trying to distract another woman from the chaos happening outside the jeep theyโ€™re traveling in.ย  He says to her โ€œIf I start out with a penny on the first day of a 31 day month and kept doubling it each day, so Iโ€™d have .01 on day 1, .02 on day 2, etc.ย  How much money will I have at the end of the month?โ€ The woman franticly spouts out a wrong answer and the gentleman responds โ€œYouโ€™d have over ten million dollars by the end of the monthโ€.ย  The car goes on to crash just after that scene but as a matter of fact, youโ€™d have exactly $10,737,418.20 at the end of the 31-day month.ย  This is an example of a geometric sequence because you start out with 0.01 and to get to the next term (day), you would multiply by a common ratio of 2.


green line

What interesting things can you say about the people who contributed to the discovery and/or the development of this topic?

Geometric sequences are popularly found in Book IX of Elements by Euclid, dating back to 300 B.C.ย  Euclid of Alexandria, a famous Greek mathematician also considered the โ€œFather of Geometryโ€ was the main contributor of this theory.ย  Geometric sequences and series are one of the easiest examples of infinite series with finite sums.ย  Geometric sequences and series have played an important role in the early development of calculus, and have continued to be a main case of study in the convergence of series.ย  Geometric sequences and series are used a lot in mathematics, and they are very important in physics, engineering, biology, economics, computer science, queuing theory, and even finance.


green line

How can technology (specifically Khan Academy/YouTube) be used to effectively engage students with this topic:


I really like the video that Khan Academy does on YouTube about Geometric Sequences.ย  This particular video is a very good introduction to Geometric Sequences because he explains the difference between Geometric Sequences and Series, which I thought to be helpful because I always got the two confused with each other.ย  Mr. Khan starts out by explaining what exactly a Geometric Sequence is. He describes a Geometric sequence as โ€œA progression of numbers where each successive number is a fixed multiple of the one before it.โ€ He goes on to give numerical examples to specifically show you what he means.ย  He explains that a1 is typically our first term; a2 is the second term, etc.ย  He then explains that to get from a1 to a2, you will multiply a1 by the โ€œcommon ratioโ€ usually represented by โ€œr. For example, โ€œ3, 12, 48, 192โ€ is a finite geometric sequence where the common ratio, r, is 4 because to go from 3 to 12 or from 12 to 48, you multiply by 4. He goes on to explain that a Geometric Sequence is a list (sequence) of numbers (terms) that are being multiplied by a common ratio and that a Geometric Series is the sum of the terms (numbers) in the Geometric Sequence.ย  Using the same numbers as from the Geometric Sequence above, the geometric series is โ€œ3+12+48+192โ€.


References:

ย 


Engaging students: Graphing parametric equations

In my capstone class for future secondary math teachers, I ask my students to come up with ideas for engaging their students with different topics in the secondary mathematics curriculum. In other words, the point of the assignment was not to devise a full-blown lesson plan on this topic. Instead, I asked my students to think about three different ways of getting their students interested in the topic in the first place.

I plan to share some of the best of these ideas on this blog (after asking my students’ permission, of course).

This student submission comes from my former student Perla Perez. Her topic, from Precalculus: graphing parametric equations.

green line

How can technology (YouTube, Khan Academy [khanacademy.org], Vi Hart, Geometers Sketchpad, graphing calculators, etc.) be used to effectively engage students with this topic? Note: It’s not enough to say “such-and-such is a great website”; you need to explain in some detail why it’s a great website.


Graphing calculators and online sketch pads can allow students to be able to visually see how parametric equations look like. Letโ€™s say the teachers is just introducing parametric equations for the first time to his/her students. Since technology is advancing at a fast rate using an online sketchpad such as, http://www.sineofthetimes.org/the-art-of-parametric-equations-2/, allows student/anyone to explore without much thought. Using the sketch pad above, have students create different figures by moving the blue, green, and red slides. The figures represent can range from:


Have a couple student present a figure they like to the class and begin asking simple question like: Why did you chose this picture? Which slides did you use to get here? What did you observe of this sketch? What happens to the equations when you move one of the slides? After the last students shows their figure, bring the class together. Explain that the goal for the next few classes is to be able to graph similar graphs. Although the parametric equations on this sketchpad may be advanced for a high school pre-calculus class, this allows students to get a broader sense of where their high school education can grow.


Resources:

http://www.sineofthetimes.org/the-art-of-parametric-equations-2/


green line

What interesting things can you say about the people who contributed to the discovery and/or the development of this topic? (You might want to consult Math Through The Ages.)

ย 

Jules Lissajousย (1822โ€“1880) was a professor of mathematics in Lycรฉe Saint-Louis from 1847 till 1874. During this time, though, he mainly focused on the study of vibrations and sound. It is because of him (mainly) that we can visually see sound. The way this was done was by parametric equations specially x=asin(w1t+z2), y=bsin(w2+z2), where a, b are amplitudes w1, w2 angular frequencies, z1, z2 phases, and t is time. Using this he was able to create, โ€œpatterns formed when two vibrations along perpendicular lines are superimposedโ€. To a high school student essentially resembles a coordinate plane. Even though he won the Lacaze Prize in 1867 for what many call, โ€œbeautiful experimentsโ€, a man named Nathaniel Bowditch produced them using a compound pendulum in 1815. Even though the work isnโ€™t new, Lissajous did his work independently. Jules has helped advanced our studies of not only math but in physics.


Resources:

http://www.hit.bme.hu/~papay/edu/Lab/Lissajous.pdf

http://www-groups.dcs.st-and.ac.uk/history/Biographies/Lissajous.html

http://www.s9.com/Biography/lissajous-jules-antoine/


green line

What interesting (i.e., uncontrived) word problems using this topic can your students do now? (You may find resources such as http://www.spacemath.nasa.gov to be very helpful in this regard; feel free to suggest others.)


Students in algebra learn how to graph a function in a coordinate plane as well as be able to solve for an equation from a graph. Before, students begin to graph parametric equations for the most have some understanding of what a parametric equation is, at least in most situations. To take the students to the next level and build on their understanding, interesting world problems such as the one below can help the process go more smoothly. This worksheet begins with something students should be able to complete and expand to what graphs of a parametric equations look like.

This word problem is:

Begin by having students fill the table out. Take a moment to check studentโ€™s results. Next, challenge the students to attempt to plot and describe the graph as asked in part b and c. From there on, the instructor can go over what these parts mean. This is a great way to start having student connect their knowledge of equations to a graph to even more topics in-depth.


Resources:

http://www.austincc.edu/lochbaum/11-3%20Parametric%20Equations.pdf

Engaging students: Computing trigonometric functions using a unit circle

In my capstone class for future secondary math teachers, I ask my students to come up with ideas for engaging their students with different topics in the secondary mathematics curriculum. In other words, the point of the assignment was not to devise a full-blown lesson plan on this topic. Instead, I asked my students to think about three different ways of getting their students interested in the topic in the first place.

I plan to share some of the best of these ideas on this blog (after asking my students’ permission, of course).

This student submission comes from my former student Sarah Asmar. Her topic, from Precalculus: computing trigonometric functions using a unit circle.

green line

How could you as a teacher create an activity or project that involves your topic?

Learning the unit circle can be very challenging for many students. One must know all the elements of the circle and need to know how to apply it. Therefore, I have come up with a few activities to make learning the unit circle more fun and engaging. One activity that would be great when teaching students how to memorize the unit circle and all the elements of it is the game of โ€œI Have Who Has.โ€ย  I would create a stack of note cards that would have one element of the unit circle on it. For example, one card will have 90ยฐ while another will have ฯ€. I will do that for all the elements on the unit circle. Then, I would pass out one note card to each student. One student will begin by saying โ€œI have 2ฯ€, who has 0ยฐ or 360ยฐ?โ€ Then, the student that has the card with those two elements on it will say what they have and ask who has the next element. This will go on until all of the elements have been said and it returns to the student that started the game.ย  Another activity I found that would help students see the unit circle in a more colorful way is if they created it on a paper plate using colored yarn or colored markers. The x and y axis would be in one color and the rest would be in different colors. They would label each line/angle with the correct degree and radian, and the correct (x, y). Here is the link to a picture of what I would want the students to do: https://s-media-cache-ak0.pinimg.com/736x/74/e9/23/74e9232e7389804ce4df2ea6890e0ff9.jpg


green line

How does this topic extend what your students should have learned in previous courses?

Students first see trigonometry in Geometry class as sophomores in high school, but they typically go into more depth during pre-calculus. One way to compute trigonometric functions using the unit circle is by using right triangles. You can find the angle measurement by drawing a right triangle on the unit circle and connect two points. The two special right triangles (30-60-90 and 45-45-90) can be used to form the unit circle. Students would need to recall the rules from geometry to figure out the side lengths of the triangles. With this, students are forced to remember what they were taught in geometry class in order to compute trigonometric functions. If students can see how using the two special triangles creates the unit circle, then it might make more sense to them as where all the measurements/elements came from.


green line

How can technology be used to effectively engage students with this topic?

Technology plays a big role in education these days. Students and teachers are encouraged to use technology in the classroom. Khan Academy is one of my favorite websites. He creates very detailed videos about every mathematical topic. I found a few videos on his website to show my students that would help them understand how to use sine, cosine, and tangent with the unit circle. He even has a video that shows a way to remember the unit circle. Another way to implement technology use with tis topic would be with the graphing calculator. Students tend to believe the calculator more than their own teacher. If they saw that the calculator gave them the same exact values as the found using the unit circle, I think they would be amazed and understand how the calculator finds them as well. They might see themselves as smart as the calculator if they can figure out the values by hand and then using the calculator to check their work. I also, might try to find a funny YouTube video that would help the students remember the parts of the unit circle. Once they have the unit circle memorized, it is much easier using it to compute trigonometric functions. Students tend to be more engaged and willing to do something when technology is involved.


References:


https://www.khanacademy.org/math/trigonometry/unit-circle-trig-func/unit-circle-definition-of-trig-functions/v/a-way-to-remember-the-entire-unit-circle-for-trigonometry


Engaging students: Graphing an ellipse

In my capstone class for future secondary math teachers, I ask my students to come up with ideas for engaging their students with different topics in the secondary mathematics curriculum. In other words, the point of the assignment was not to devise a full-blown lesson plan on this topic. Instead, I asked my students to think about three different ways of getting their students interested in the topic in the first place.

I plan to share some of the best of these ideas on this blog (after asking my students’ permission, of course).

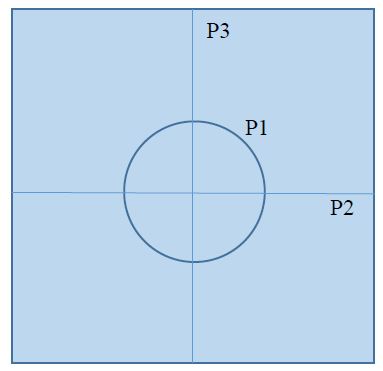
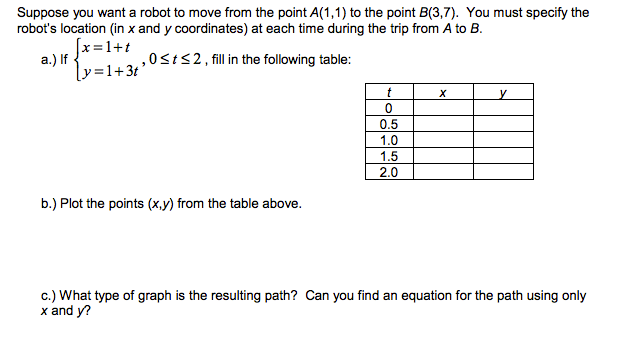
This student submission comes from my former student Marissa Arevalo. Her topic, from Precalculus: graphing an ellipse.

green line

How have different cultures throughout time used this topic in their society?


In a philosophy paper, I wrote a about the usage of ellipses that applied not only to the field of mathematics but theology and science (more specifically astronomy), and the implications it had throughout time. Throughout centuries, mankind has argued over the ways of the universe and whether or not we are the center of that universe or if something else is. From the times of Ancient Greece, Aristotle believed that the center of our universe revolved around a form of unchanging matter that did not obey the laws of the planet earth. Ptolemy rejected this idea and created a model of a universe centered around Earth itself where the other planets revolved around us, but he could not answer as to why the planetary orbits did not follow a circular path. Later on in the 14th and 15th centuries Copernicus and Galileo respectively argued for a system that orbited the sun rather than the Earth. This idea went against the beliefs of the church and their research caused Galileo to be held into persecution for his radical ideas (Copernicus died before any due harm came to him). It was not until Johannes Kepler, under the tutelage of his teacher Tycho Brahe, observed the motion of the planet Mars and noted that the path did not actually follow a circular path but an elliptical one. His findings disproved his teacher, who was a firm advocate of the church and believed in a geocentric model, showing that the planets were centered around the sun. Sir Isaac Newtonโ€™s Laws of Gravity later proved Keplerโ€™s theories, and to this day are known as Keplerโ€™s Laws of Planetary Motion.

We utilize these laws and other properties in order to define what it means to be a planet, therefore a planet:

  1. Must be round in physical shape
  2. Must have an elliptical path around the sun
  3. Must be able to clear anything that comes into its orbital path

These properties defined all of our planets, except Pluto, who it was discovered to be smaller than other things that existed in its orbit in the Kuiper Belt and therefore cannot have the third property. While the orbital pattern of Pluto followed the guidelines of the other planets (though with a greater eccentricity), Pluto was too small, therefore removing it off the list of planets in the solar system in 2006 and was defined as a โ€œdwarf planetโ€. While the students of this time may not relate to the surprise of the reclassification of Pluto in our solar system, it is still relatable to todayโ€™s society as this long debate of the way planets move and how our universe was created greatly impacts science even today as we make new discoveries over other celestial bodies in our universe.


green line

How can technology (YouTube, Khan Academy [khanacademy.org]. Vi Hart, Geometers, graphing calculators, etc.) be used to effectively engage students with this topic?


A website that can be utilized for students to get more involved in their own learning would be Gizmos where the students can be given a small exploration sheet in which they can compare the graph of ellipse to its equation and what exactly affects the shape of the ellipse as different aspects are altered. The students can also manipulate the graph and watch the standard form of the equation change over time. The site allows theย  student to also see the pythagorean and geometric relationships and definitions of an ellipse as the equation is altered. One very important key feature on the exploration of the geometric definition is that the student is able to plot the purple point that moves along the edge of the figure in different locations to show the relationship between the lengths of foci from the edge. The only downside may be that while the teacher can use the site for a short free trial, they may have to make payments in order to continue using it. Desmos is another website that can graph ellipse equations, but it does not provide the ability to see the geometric definition applied to the graph of the function.


green line

How could you as a teacher create an activity or project that involves your topic?

Another idea that would have the students thinking about the geometric concepts surrounding the properties of an ellipse would be for the teacher to have worksheets in which the students would show the representation of where an ellipse could be formed in the cutting of double-napped cone with a plane. The students could lead discussions in their own ideas and how an ellipse, hyperbola, parabola, and circle are created if you literally sliced the cones into pieces. The teacher could have either a physical model of the cones or have the students create the physical model of the cones with play-doh and cut the cones with cardboard/plastic-wear/dental floss (preferred) and describe the shape that was created in by the cuts made. (Another idea is to make the cones with Rice Krispies or scones and jam/chocolate) The good thing about this play-doh is approximately 50 cents at Wal-Mart and provide a nice way for students to make mistakes and restart without having to clean that big of a mess up. The students will be more involved in the material if they are able to create physical models and form their own ideas on things that many teachers do not address in their lessons. This is coming from personal experience of not knowing certain geometric properties of conic sections until taking college courses.

ย 

ย 

ย 

ย 

References:


https://www.desmos.com/calculator


https://illuminations.nctm.org/uploadedFiles/Content/Lessons/Resources/9-12/CuttingConics-AS.pdf


https://www.pinterest.com/pin/480759328950528032/


https://www.pinterest.com/pin/343540277799331864/


https://www.explorelearning.com/index.cfm?method=cResource.dspView&ResourceID=132


http://mste.illinois.edu/courses/ci399TSMsu03/folders/jmpeter1/Daily%20Assignments/Conic%20Sections/Ellipse%20Paper%20Folding(CI399).html


Cain, F. (2012). Why Pluto is No Longer a Planet – Universe Today. Retrieved March 22, 2016, from http://www.universetoday.com/13573/why-pluto-is-no-longer-a-planet/


Helden, A. V. (2016, February 17). Galileo. Retrieved March 22, 2016, from http://

http://www.britannica.com/biography/Galileo-Galilei


Jones, A. R. (n.d.). Ptolemaic system. Retrieved March 22, 2016, from http://

http://www.britannica.com/topic/Ptolemaic-system


Leveillee, N. P. (2011). Copernicus, Galileo, and the Church: Science in a Religious World.


Student Pulse, 3(5), 1-2. Retrieved March 15, 2016, from http://www.studentpulse.com/

articles/533/copernicus-galileo-and-the-church-science-in-a-religious-world


Rosenburg, M. (2015, April 22). Scientiflix. Retrieved March 22, 2016, from http://

scientiflix.com/post/117082918519/keplers-first-law-of-motion-elliptical-orbits


Simmons, B. (2016, February 21). Mathwords: Foci of an Ellipse. Retrieved March 22, 2016,

from http://www.mathwords.com/f/foci_ellipse.htm


The Universe of Aristotle and Ptolemy. (n.d.). Retrieved March 22, 2016, from http://

csep10.phys.utk.edu/astr161/lect/retrograde/aristotle.html


Westman, R. S. (2016, February 21). Johannes Kepler. Retrieved March 22, 2016, from http://

http://www.britannica.com/biography/Johannes-Kepler