In my capstone class for future secondary math teachers, I ask my students to come up with ideas for engaging their students with different topics in the secondary mathematics curriculum. In other words, the point of the assignment was not to devise a full-blown lesson plan on this topic. Instead, I asked my students to think about three different ways of getting their students interested in the topic in the first place.
I plan to share some of the best of these ideas on this blog (after asking my students’ permission, of course).
This student submission comes from my former student Perla Perez. Her topic, from Precalculus: graphing parametric equations.

How can technology (YouTube, Khan Academy [khanacademy.org], Vi Hart, Geometers Sketchpad, graphing calculators, etc.) be used to effectively engage students with this topic? Note: It’s not enough to say “such-and-such is a great website”; you need to explain in some detail why it’s a great website.
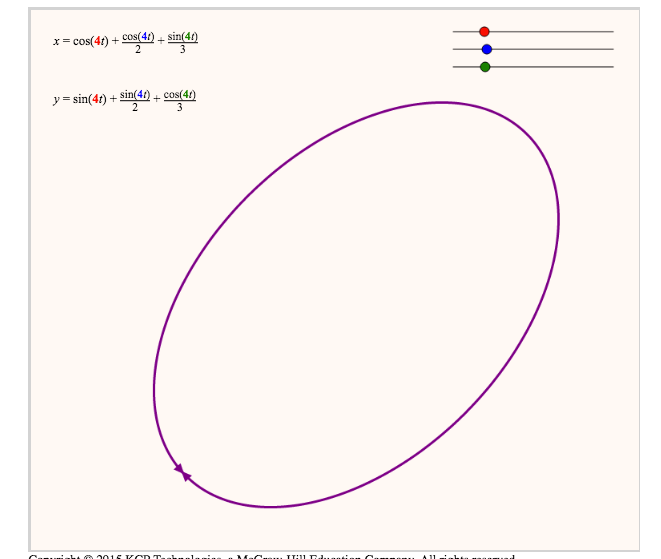
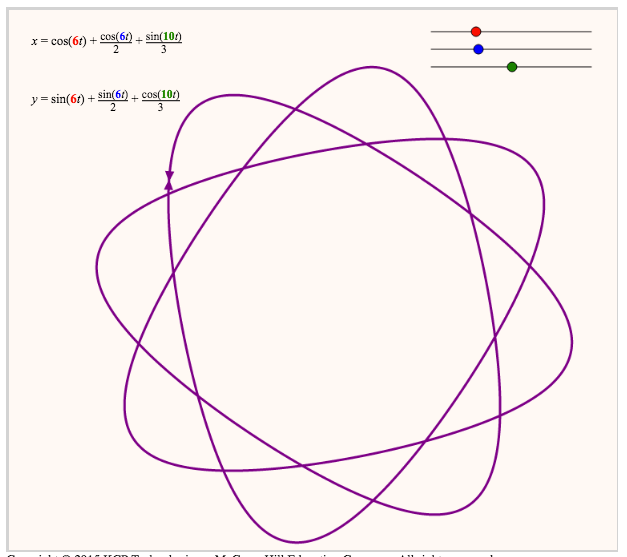
Graphing calculators and online sketch pads can allow students to be able to visually see how parametric equations look like. Let’s say the teachers is just introducing parametric equations for the first time to his/her students. Since technology is advancing at a fast rate using an online sketchpad such as, http://www.sineofthetimes.org/the-art-of-parametric-equations-2/, allows student/anyone to explore without much thought. Using the sketch pad above, have students create different figures by moving the blue, green, and red slides. The figures represent can range from:

Have a couple student present a figure they like to the class and begin asking simple question like: Why did you chose this picture? Which slides did you use to get here? What did you observe of this sketch? What happens to the equations when you move one of the slides? After the last students shows their figure, bring the class together. Explain that the goal for the next few classes is to be able to graph similar graphs. Although the parametric equations on this sketchpad may be advanced for a high school pre-calculus class, this allows students to get a broader sense of where their high school education can grow.
Resources:
http://www.sineofthetimes.org/the-art-of-parametric-equations-2/
What interesting things can you say about the people who contributed to the discovery and/or the development of this topic? (You might want to consult Math Through The Ages.)
Jules Lissajous (1822–1880) was a professor of mathematics in Lycée Saint-Louis from 1847 till 1874. During this time, though, he mainly focused on the study of vibrations and sound. It is because of him (mainly) that we can visually see sound. The way this was done was by parametric equations specially x=asin(w1t+z2), y=bsin(w2+z2), where a, b are amplitudes w1, w2 angular frequencies, z1, z2 phases, and t is time. Using this he was able to create, “patterns formed when two vibrations along perpendicular lines are superimposed”. To a high school student essentially resembles a coordinate plane. Even though he won the Lacaze Prize in 1867 for what many call, “beautiful experiments”, a man named Nathaniel Bowditch produced them using a compound pendulum in 1815. Even though the work isn’t new, Lissajous did his work independently. Jules has helped advanced our studies of not only math but in physics.
Resources:
http://www.hit.bme.hu/~papay/edu/Lab/Lissajous.pdf
http://www-groups.dcs.st-and.ac.uk/history/Biographies/Lissajous.html
http://www.s9.com/Biography/lissajous-jules-antoine/
What interesting (i.e., uncontrived) word problems using this topic can your students do now? (You may find resources such as http://www.spacemath.nasa.gov to be very helpful in this regard; feel free to suggest others.)
Students in algebra learn how to graph a function in a coordinate plane as well as be able to solve for an equation from a graph. Before, students begin to graph parametric equations for the most have some understanding of what a parametric equation is, at least in most situations. To take the students to the next level and build on their understanding, interesting world problems such as the one below can help the process go more smoothly. This worksheet begins with something students should be able to complete and expand to what graphs of a parametric equations look like.
This word problem is:
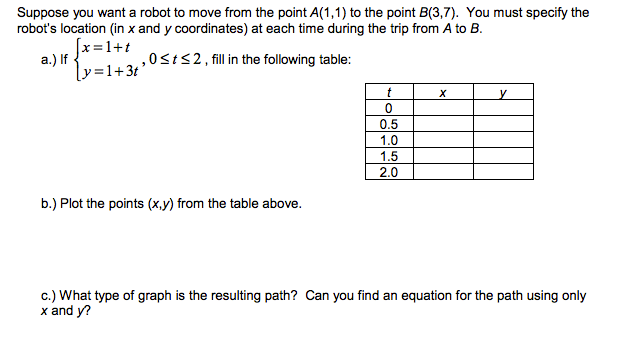
Begin by having students fill the table out. Take a moment to check student’s results. Next, challenge the students to attempt to plot and describe the graph as asked in part b and c. From there on, the instructor can go over what these parts mean. This is a great way to start having student connect their knowledge of equations to a graph to even more topics in-depth.
Resources:
http://www.austincc.edu/lochbaum/11-3%20Parametric%20Equations.pdf

The first link actually gets me interested in math again. It’s genuinely pretty to look at :o)