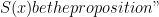
Let be the proposition “We find a new way of living at place and at time ,” and let be the proposition “We find a way of forgiving at place and .” Translate the logical statement
.
This matches almost perfectly one of the lines from the classic song “Somewhere” from the musical West Side Story.
Context: This semester, I taught discrete mathematics for the first time. Part of the discrete mathematics course includes an introduction to predicate and propositional logic for our math majors. As you can probably guess from their names, students tend to think these concepts are dry and uninteresting even though they’re very important for their development as math majors.
In an effort to making these topics more appealing, I spent a few days mining the depths of popular culture in a (likely futile) attempt to make these ideas more interesting to my students. In this series, I’d like to share what I found. Naturally, the sources that I found have varying levels of complexity, which is appropriate for students who are first learning prepositional and predicate logic.
When I actually presented these in class, I either presented the logical statement and had my class guess the statement in actual English, or I gave my students the famous quote and them translate it into predicate logic. However, for the purposes of this series, I’ll just present the statement in predicate logic first.
Let be the proposition “The Stars and Stripes wave at time .” Translate the logical statement
.
I tried to think of a fitting example for the Fourth of July, but the best that I could find was the closing line of the chorus of the Stars and Stripes Forever.
Which naturally leads me to this amazing version from the 1970s:
Context: This semester, I taught discrete mathematics for the first time. Part of the discrete mathematics course includes an introduction to predicate and propositional logic for our math majors. As you can probably guess from their names, students tend to think these concepts are dry and uninteresting even though they’re very important for their development as math majors.
In an effort to making these topics more appealing, I spent a few days mining the depths of popular culture in a (likely futile) attempt to make these ideas more interesting to my students. In this series, I’d like to share what I found. Naturally, the sources that I found have varying levels of complexity, which is appropriate for students who are first learning prepositional and predicate logic.
When I actually presented these in class, I either presented the logical statement and had my class guess the statement in actual English, or I gave my students the famous quote and them translate it into predicate logic. However, for the purposes of this series, I’ll just present the statement in predicate logic first.
Let be the proposition “You can fool at time .” Translate the logical statement
.
Of course, this is the famous quote commonly attributed to Abraham Lincoln: “You can fool all of the people some of the time, and some of the people all of the time, but you cannot fool all of the people all of the time.”
Context: This semester, I taught discrete mathematics for the first time. Part of the discrete mathematics course includes an introduction to predicate and propositional logic for our math majors. As you can probably guess from their names, students tend to think these concepts are dry and uninteresting even though they’re very important for their development as math majors.
In an effort to making these topics more appealing, I spent a few days mining the depths of popular culture in a (likely futile) attempt to make these ideas more interesting to my students. In this series, I’d like to share what I found. Naturally, the sources that I found have varying levels of complexity, which is appropriate for students who are first learning prepositional and predicate logic.
When I actually presented these in class, I either presented the logical statement and had my class guess the statement in actual English, or I gave my students the famous quote and them translate it into predicate logic. However, for the purposes of this series, I’ll just present the statement in predicate logic first.
Let latex x$ is a sucker,” and let be the proposition “ is born at time t.” Translate the logical statement
.
Naturally, this is the famous quote often attributed to P. T. Barnum: “There’s a sucker born every minute.”
Context: This semester, I taught discrete mathematics for the first time. Part of the discrete mathematics course includes an introduction to predicate and propositional logic for our math majors. As you can probably guess from their names, students tend to think these concepts are dry and uninteresting even though they’re very important for their development as math majors.
In an effort to making these topics more appealing, I spent a few days mining the depths of popular culture in a (likely futile) attempt to make these ideas more interesting to my students. In this series, I’d like to share what I found. Naturally, the sources that I found have varying levels of complexity, which is appropriate for students who are first learning prepositional and predicate logic.
When I actually presented these in class, I either presented the logical statement and had my class guess the statement in actual English, or I gave my students the famous quote and them translate it into predicate logic. However, for the purposes of this series, I’ll just present the statement in predicate logic first.
Let be the proposition “ is my ex,” and let be the proposition “ lives in Texas.” Translate the logical statement
,
where the domain is all people.
Naturally, this one of the great hits in the storied career of George Strait.
Context: This semester, I taught discrete mathematics for the first time. Part of the discrete mathematics course includes an introduction to predicate and propositional logic for our math majors. As you can probably guess from their names, students tend to think these concepts are dry and uninteresting even though they’re very important for their development as math majors.
In an effort to making these topics more appealing, I spent a few days mining the depths of popular culture in a (likely futile) attempt to make these ideas more interesting to my students. In this series, I’d like to share what I found. Naturally, the sources that I found have varying levels of complexity, which is appropriate for students who are first learning prepositional and predicate logic.
When I actually presented these in class, I either presented the logical statement and had my class guess the statement in actual English, or I gave my students the famous quote and them translate it into predicate logic. However, for the purposes of this series, I’ll just present the statement in predicate logic first.
In my capstone class for future secondary math teachers, I ask my students to come up with ideas for engaging their students with different topics in the secondary mathematics curriculum. In other words, the point of the assignment was not to devise a full-blown lesson plan on this topic. Instead, I asked my students to think about three different ways of getting their students interested in the topic in the first place.
I plan to share some of the best of these ideas on this blog (after asking my students’ permission, of course).
This student submission comes from my former student Zacquiri Rutledge. His topic, from Precalculus: using vectors in two dimensions.
Add vector A and vector B, what do you get? How about when we take the dot product of A and B? What is the magnitude of A, B, and A+B? All of these are basic questions that a teacher might ask their students during a basic high school pre-calculus class. However, how does the teacher respond when a student asks “Where am I ever going to see this again”? In mathematics, a student might never see vectors again unless they take higher math such as Calculus I through III, or possibly Linear Algebra. During the first two courses of Calculus students will continue to expand on the ideas of two dimensional vectors by talking about the path an object might take through the air after leaving a cannon or being thrown off a cliff. Calculus III (or vector calculus) however is a much stronger example of how vectors will be used in further education of mathematics. During this class students will not only look at two dimensional vectors and review simpler ideas, but they will expand these ideas into the three dimensional world creating three dimensional vectors. Here students will discuss what kind of shape or planes a combination of three vectors might create.
A scientific use for two dimensional vectors is in physics. During a physics class, students talk about forces that act on objects as they move or when an object hits another. To do this, students draw vectors to represent the magnitude of the force that is acting on the object and the direction the force pushes or pulls the object. For example, in the previous paragraph it was mentioned about an object being shot from a cannon and the students measuring the path the object might take. In physics, the students might do the exact same thing, but by looking more in depth at the forces acting on the object. Forces might include the force of the cannon firing the object at a certain angle into the air, gravity pulling that object toward the ground, and even the friction of the air on the object as it soars through the air. Each one of these forces is acting on the object as it moves, either helping the object move farther and faster or attempting to slow it down. However, two dimensional physics is not the end of vectors; just like calculus, physics goes on to discuss what happens to objects in a three dimensional world and the forces that act on them. So a very easy answer to give the student asking where he/she will see vectors again is in every day real life.
You have explained to your students that vectors are in everyday life and they still do not believe you. You have shown them countless examples on the board, drawing pictures of airplanes and the paths they fly through the air, objects being dropped from a cliff, objects being shot from a cannon, et cetera, and they still do not believe that vectors have any importance or use! Then you simply ask, has anyone ever seen a show called MythBusters on the Discovery Channel? Now MythBusters is a very well-known show, not only because it has been around for twelve years, but also for some of the crazy things that they test in the name of science. For example, some of my personal favorites include them making a boat out of pykrete, the many episodes on the uses of duct tape, and testing if a bullet dropped at the same time as a bullet shot from a gun will hit the ground at the same time. The great thing about this show is it is full of great examples of how physics affects things in real life. Also, not only do they test the myths, they explain how they are testing them, why they are testing them the way they are, and why it makes sense scientifically or does not. For example, during the bullet episode, they explain that once the bullet is shot from the gun, the only forces acting on the bullet are gravity and air friction. The only forces that would be acting on the bullet dropped would gravity and air friction as well. So in theory these two bullets should hit the ground at the exact same time if they are projected from the same height. By the end of the episode they had proven this by figuring out the best way to set up a live test and using a high speed camera to measure the time it took for each to hit the ground. For a high school class, this would be very easy to draw on a chalk board and walk the students through the thought process of why this happens using vectors to draw out the forces.
Finally, the Internet gives us access to a lot of videos. This would allow a teacher who is talking about Mythbusters and their amazing examples of vectors in motion the chance to display quick clips of some of their tests. Of course the teacher will need to have researched a few before class in order to make sure they can be used as vector examples, but after a video has been played the teacher could ask the students to explain why the test was either plausible or false. On a small scale this video, https://www.youtube.com/watch?v=BLuI118nhzc , works great to show how a truck moving at the same speed as a soccer ball being shot from the back cancels the two forces, leaving gravity as the only force acting on the ball. Using vectors, a teacher could explain how one vector is positive and the other is negative of the same magnitude, cancelling the other out. Then show how only one vector on the ball remains, pulling the ball in that direction.
In my capstone class for future secondary math teachers, I ask my students to come up with ideas for engaging their students with different topics in the secondary mathematics curriculum. In other words, the point of the assignment was not to devise a full-blown lesson plan on this topic. Instead, I asked my students to think about three different ways of getting their students interested in the topic in the first place.
I plan to share some of the best of these ideas on this blog (after asking my students’ permission, of course).
This student submission comes from my former student Taylor Vaughn. Her topic, from Precalculus: the Fibonacci sequence.
How has this topic appeared in pop culture (movies, TV, current music, video games, etc.)?
The article “Music and the Fibonacci sequence and Phi” talks about how the Fibonacci sequence correlates how the keys on the piano are laid out. Also talks about how the sequence also affects the frequency of chords. One thing I like about this article is that it doesn’t just talk about the sequence in one way, like how the instrument is made, but also different aspects like the chord. In other showings of the Fibonacci sequence they talk about pine cones and flowers. Personally, I think that music is something that is more relatable to students and a lot of people have seen a piano, but never just thought about the making. People who are that involved in music, probably noticed that there was some pattern to the keys, but didn’t think that by any chance that it was related to math.
What interesting things can you say about the people who contributed to the discovery and/or the development of this topic?
Since the sequence is named Fibonacci sequence you may think that the founder’s name is Fibonacci, but actually his name is Leonardo of Pisa. The nickname Fibonacci comes from the shortening of the Latin term “filius Bonacci”, which means son of Bonacci. Well why does that matter? That was his dad’s last name. Also, the Latin phrase is incorporated in the title of his book. One thing that I found cool, was that Leonardo actually had a North African education. When talking about mathematicians you never hear anything about Africa. So let’s look at the history of the sequence itself. After reading a few articles, some believe that he actually didn’t discover the sequence himself, but merely saw it during his travels and he was the one to actually write about it. Edouard Lucas is the person who named the sequence, the Fibonacci sequence. When Fibonacci wrote about the sequence it was in the 1200’s, Lucas wasn’t around until the 1800’s. That is 600 years that the sequence didn’t have a name. So during that time, what did people refer to it as? I really don’t know. Lucas is the person to look more into the sequence and noticed that the numbers have a common ratio, which is now called the golden ratio, he also discovered other patterns that lie in the sequence.
How can technology (YouTube, Khan Academy [khanacademy.org], Vi Hart, Geometers Sketchpad, graphing calculators, etc.) be used to effectively engage students with this topic?
The video Doodling in Math: Spirals, Fibonacci, and Being a Plant [1 of 3] was an engaging video because it actually shows the sequence in different objects. For example, when she talks about the sequence in pine cones she actually gets glitter paint, and shows and counts the diagonals on the pine cone. Also I like that she uses pine cones of different sizes and shapes, and shows that the pattern still holds s that students don’t think that it was planned that she picked up that type of pine cone. I also like that she brings in relevant object like fruit. I think this is a good engage because it shows patterns of things that students see often, but never stopped and paused to think about. One thing I don’t like about Vi Hart is the speed that she talks. I normally have to watch the video multiple times to get all the information she gives. In a classroom, you really don’t have the time to allow students to watch the video multiple times. This video could also be given as homework before their lesson and it would allow students to watch it multiple times and could turn in their notes, or provide questions for them to answer. I definitely think that the video is cool and would spike some interest in entering sequences.
Citations
Meisner, Gary. “Music and the Fibonacci Sequence and Phi – The Golden Ratio: Phi, 1.618.” The Golden Ratio Phi 1618. N.p., 04 May 2012. Web. 15 Nov. 2015.
Knott, Dr. Ron. “Contents of This Page.” Who Was Fibonacci? Ron Knott, 11 Mar. 1998. Web. 15 Nov. 2015.
Knott, Ron, and The Plus Team. “The Life and Numbers of Fibonacci.” The Life and Numbers of Fibonacci. N.p., 4 Nov. 2013. Web. 15 Nov. 2015.
Hart, Vi. “Doodling in Math: Spirals, Fibonacci, and Being a Plant [1 of 3].” YouTube. YouTube, 21 Dec. 2011. Web. 15 Nov. 2015.
In my capstone class for future secondary math teachers, I ask my students to come up with ideas for engaging their students with different topics in the secondary mathematics curriculum. In other words, the point of the assignment was not to devise a full-blown lesson plan on this topic. Instead, I asked my students to think about three different ways of getting their students interested in the topic in the first place.
I plan to share some of the best of these ideas on this blog (after asking my students’ permission, of course).
This student submission comes from my former student Rory VerNesie. His topic, from Precalculus: graphing rational functions.
So one question may be how this topic can be used in your students future courses in math or science? The students start to learn about this concept in high school, and progressively builds on it until they are expected to know it in college. Courses that require this are: Complex Analysis, Numerical Analysis, Differential Equations, Abstract Algebra, Real Analysis and Meromorphic Functions. These classes deal with understanding what happens as we approach a limit or when the denominator approaches zero. In Abstract Algebra, they talk about a Field of Rational Expressions while Complex Analysis deals with a ratio of polynomials with complex coefficients. In Differential Equations, Rational Functions are seen in slope fields, Separable Equations, and Exact equations. Also in Real Analysis, the talk about convergence using 1/n. Also, Laplace Transforms and partial fractions in electronics and physics may need graphing along with partial fraction decomposition. All in all, graphing Rational Functions is a important part of math because they deal with division over zero or a singularity.
Next, a very important man in the history of rational functions and their graphs was Charles Hermite. This man found a way or algorithm to integrate Rational Functions, while in early 19th century Ostrowski extended this idea and algorithm to Rational Expressions. The neat thing about Hermite is that he helped extend this idea to complex numbers and developed the idea of using interpolation to find the coefficients of rational functions. Without these contributions from Hermite and Ostrowski we would not be able to graph the derivatives of rational functions or the anti derivatives of rational functions. The methods discovered by these men were profound and in some ways led to the discovery of news ideas in math such as partial decomposition and other integration techniques that help integrate Rational Functions. Without these men, Rational Functions and there uses would be known about less.
A great activity involving graphing rational functions would be to have the kids get into groups and assign the each group a certain rational function. Every group would have a team leader who would be in charge of making sure everything about the function gets done. These responsibilities would include, graphing the function, finding the zeros of the function, the asymptotes(Horizontal and Vertical), Removable Discontinuities if any, and the y intercept. The students would then present what they found and would answer any questions for the class. This activity would be a good cooperative learning exercise for students who maybe are not the best at math. This could be a major confidence booster and fun activity for the students. Also they students are learning from each other so they are engaging in discovery learning.
All in all, graphing rational functions is a major part of mathematics and all of these statements mentioned above show how important rational functions are. They deal with division by zero and limits and are a great way to engage students in the novelty of singularities. Graphing polynomials also look really neat when you graph them.
In my capstone class for future secondary math teachers, I ask my students to come up with ideas for engaging their students with different topics in the secondary mathematics curriculum. In other words, the point of the assignment was not to devise a full-blown lesson plan on this topic. Instead, I asked my students to think about three different ways of getting their students interested in the topic in the first place.
I plan to share some of the best of these ideas on this blog (after asking my students’ permission, of course).
This student submission comes from my former student Perla Perez. Her topic, from Precalculus: graphing with polar coordinates.
How does this topic extend what your students should have learned in previous courses?
Graphing polar coordinates is usually taught in a Pre-Calculus class. Students have learned about the Cartesian Coordinates and extend their knowledge to polar coordinates. Unlike Cartesian Coordinates, which represent how to get from a specific point to the point of origin (or vice versa), the polar coordinate tells us the direction by the angle, and the distance from that point to the origin. Students will need to know how to take the measure of an angle and how to use the Pythagorean Theorem to solve for the distance which is considered the radius. Most students who are enrolled in a Pre-Calculus class have taken geometry where they have learned about the Pythagorean Theorem and what a radius is. This alongside their algebra 1 and geometry classes means they also know how to graph and plot points.
How could you as a teacher create an activity or project that involves your topic?
Polar coordinates use a different type of graph, rather than just an x and y coordinates plane. The polar coordinate plane includes symmetrical circles surrounding the center and is given a radius creating a graph that looks like a dart board. At this point students should know what a polar coordinate is. The next step is actually graphing it.
As an activity to get students excited for the wonderful world of polar coordinates, I have created a dart board game. Using an appropriate dart board, such as a magnetic one, have the students create groups of three to four student each. The point of the game is to have students create polar coordinates. The board must be properly labeled with the angles. There will be four rounds, depending on the number of members in a group. When a member throws a dart at the board it must land on a point. Wherever it lands the students must figure out the radius and the angle of the dart to the origin. This game enables students to practice finding the radius and the angle of the dart with only their previous knowledge, labels, and each other.
What interesting things can you say about the people who contributed to the discovery and/or the development of this topic?
Throughout centuries and in all parts of the world, mathematicians and astronomers have come to shape our understanding of the polar coordinate system. Two Greek astronomers Hipparchus and Archimedes used polar coordinates in much of their work. Though they didn’t commit to the full coordinate plane, Hipparchus first begins by writing a table of chords where he was able to define stellar positions. Archimedes focused on a lot on spirals and developed what now known as the Archimedes spiral, in which the radius depends on the angle. Descartes also used a simpler concept of coordinates, but relating more to the x-axis. In 1671, Sir Isaac Newton was one of the biggest contributors to the elements used in analytic geometry. The idea of polar coordinates, however, comes from a man named Gregorio Fontana (1735-1803), centuries later. Astronomers now use his polar coordinates to measure the distance of the sky and stars.
In my capstone class for future secondary math teachers, I ask my students to come up with ideas for engaging their students with different topics in the secondary mathematics curriculum. In other words, the point of the assignment was not to devise a full-blown lesson plan on this topic. Instead, I asked my students to think about three different ways of getting their students interested in the topic in the first place.
I plan to share some of the best of these ideas on this blog (after asking my students’ permission, of course).
This student submission comes from my former student Loc Nguyen. His topic, from Precalculus: introducing the number .
How could you as a teacher create an activity or project that involves your topic?
To be able to understand where the number e is produced in the first place, students need to understand how compound interest is calculated. Before introducing the number e, I will definitely create an activity for the students to work on so that they can eventually find the formula for compounding interest based on the patterns they produce throughout the process. The compound interest formula is F=P(1+r/n)nt. From this formula, I will again provide students a worksheet to work on. In this worksheet, I will let P=1, r=100%, t=1, then the compound interest formula will be F=(1+1/n)n. Now students will compute the final value from yearly to secondly.
When they do all the computation, they will see all the decimal places of the final value lining up as n gets big. And finally, they will see that the final value gets to the fixed value as n goes to infinity. That number is e=2.71828162….,
How has this topic appeared in the news?
To help the students realize how important number e is, I would engage them with the real life examples or applications. There were some news that incorporated exponential curves. First, I will show the students the news about how fast deadly disease Ebola will grow through this link http://www.npr.org/sections/goatsandsoda/2014/09/18/349341606/why-the-math-of-the-ebola-epidemic-is-so-scary. The students will eventually see how exponential curve comes into play. After that I will provide them this link, http://cleantechnica.com/2014/07/22/exponential-growth-global-solar-pv-production-installation/, in this link, the article talked about the global population rate and it provided the scientific evidence that showed the data collected represent the exponential curve. Up to this point, I will show the students that the population growth model is:
Those examples above was about the growth. For the next example, I will ask the students that how the scientists figured out the age of the earth. In this link, http://earthsky.org/earth/how-old-is-the-earth, the students will learn that the scientists used Modern radiometric dating methods to calculate the age of earth. At this time, I will show them radioactive decay formula and explain to them that this formula is used to determine the lives of the substances such as rocks:
How can technology (YouTube, Khan Academy [khanacademy.org], Vi Hart, Geometers Sketchpad, graphing calculators, etc.) be used to effectively engage students with this topic?
To introduce to the students what the number e is, I will engage them with two videos. In the first video, https://www.youtube.com/watch?v=UFgod5tmLYY, the math song “e a magic number” will engage the students why it is a magic number. While watching this clip, the students will be able to learn the history of e. Also the students will see many mathematical formulas and expressions that contain e. This will give them a heads up that they will see these in future when they take higher level math. It is also pretty humorous of how Dr. Chris Tisdell sang the song.
In the second video, https://www.youtube.com/watch?v=b-MZumdfbt8, it explained why e is everywhere. The video used probability and exponential function to illustrate the usefulness of e, and showed how e is involving in everything. It gave many examples of e such as population, finance… Also the video illustrates the characteristics of the number e and the function that has e in it. Watching these videos will enhance students’ perception and understanding on the number e, and help them to see how important this number is.
be the proposition “We find a new way of living at place
and at time
,” and let
be the proposition “We find a way of forgiving at place
.

 be the proposition “The Stars and Stripes wave at time
  .
. .
. latex x$ is a sucker,” and let
  be the proposition “
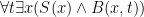 .
. be the proposition “
 be the proposition “
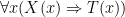 ,
, .
.


