Source: https://www.xkcd.com/2118/
Source: https://www.xkcd.com/2118/
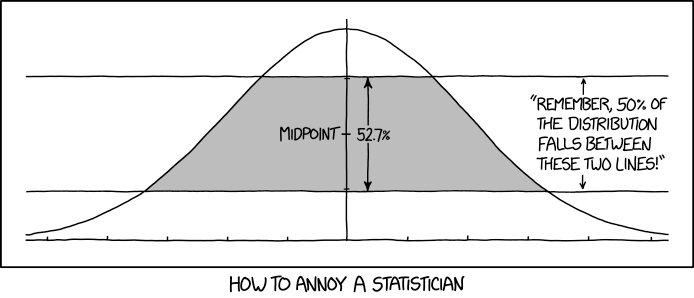
I enjoyed this article from Quanta Magazine, both for its mathematical content as well as the human interest story.

From the opening paragraphs:
Known as the Gaussian correlation inequality (GCI), the conjecture originated in the 1950s, was posed in its most elegant form in 1972 and has held mathematicians in its thrall ever since. “I know of people who worked on it for 40 years,” said Donald Richards, a statistician at Pennsylvania State University. “I myself worked on it for 30 years.”
[Thomas] Royen hadn’t given the Gaussian correlation inequality much thought before the “raw idea” for how to prove it came to him over the bathroom sink… In July 2014, still at work on his formulas as a 67-year-old retiree, Royen found that the GCI could be extended into a statement about statistical distributions he had long specialized in. On the morning of the 17th, he saw how to calculate a key derivative for this extended GCI that unlocked the proof. “The evening of this day, my first draft of the proof was written,” he said.
Not knowing LaTeX, the word processer of choice in mathematics, he typed up his calculations in Microsoft Word, and the following month he posted his paper to the academic preprint site arxiv.org. He also sent it to Richards, who had briefly circulated his own failed attempt at a proof of the GCI a year and a half earlier. “I got this article by email from him,” Richards said. “And when I looked at it I knew instantly that it was solved” …
Proofs of obscure provenance are sometimes overlooked at first, but usually not for long: A major paper like Royen’s would normally get submitted and published somewhere like the Annals of Statistics, experts said, and then everybody would hear about it. But Royen, not having a career to advance, chose to skip the slow and often demanding peer-review process typical of top journals. He opted instead for quick publication in the Far East Journal of Theoretical Statistics, a periodical based in Allahabad, India, that was largely unknown to experts and which, on its website, rather suspiciously listed Royen as an editor. (He had agreed to join the editorial board the year before.)
With this red flag emblazoned on it, the proof continued to be ignored… No one is quite sure how, in the 21st century, news of Royen’s proof managed to travel so slowly. “It was clearly a lack of communication in an age where it’s very easy to communicate,” Klartag said.
In this series, I’m compiling some of the quips and one-liners that I’ll use with my students to hopefully make my lessons more memorable for them.
This is a story that I’ll tell after doing a couple of back-to-back central limit theorem problems. Here’s the first:
The chances of winning a column bet in roulette is 12/38. The bet pays 2 to 1, meaning that if you lose, you lose $1. However, if you win, you get your $1 back and $2 more. If this bet is made 1000 times, what is the probability of winning at least $0?
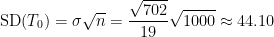
With my class, we solve this problem using standard techniques with the normal approximation:

Next, I’ll repeat the problem, except playing the game 10,000 times.
The chances of winning a column bet in roulette is 12/38. The bet pays 2 to 1, meaning that if you lose, you lose $1. However, if you win, you get your $1 back and $2 more. If this bet is made 10,000 times, what is the probability of winning at least $0?
The last three lines of the above calculation have to be changed:

In other words, the chance of winning drops dramatically. This is an example of the Law of Large Numbers: if you do something often enough, then what ought to happen eventually does happen.
As a corollary, if you’re going to bet at roulette, you should only bet a few times. And, I’ll tell my students, one Englishman took this to the (somewhat) logical extreme by going to Las Vegas and making the ultimate double-or-nothing bet, betting his entire life savings on one bet. After all, his odds of coming out ahead by making one bet were a whole lot higher than by making a sequence of bets.
Naturally, my students ask, “Did he win?” Here’s the video and the Wikipedia page:
In this series, I’m compiling some of the quips and one-liners that I’ll use with my students to hopefully make my lessons more memorable for them.
In some classes, the Greek letter 

Which begs the question, how should a student pronounce this symbol?
I tell my students that this is the Greek letter “phi,” pronounced “fee”. However, other mathematicians may pronounce it as “fie,” rhyming with “high”. Continuing,
Other mathematicians pronounce it as “foe.” Others, as “fum.”
Many years ago, the only available in-class technology at my university was the Microsoft Office suite — probably Office 95 or 98. This placed severe restrictions on what I could demonstrate in my statistics class, especially when I wanted to have an interactive demonstration of how the binomial distribution gets closer and closer to the bell curve as the number of trials increases (as long as both 

The spreadsheet in the link below is what I developed. It shows

 and standard deviation
 axis can be adjusted. For example, if
  and
and  , it doesn’t make much sense to show the full histogram; it suffices to have a maximum value around 5 or so.
In class, I take about 3-5 minutes to demonstrate the following ideas with the spreadsheet:
 is large and both and are greater than 10, then the normal curve provides a decent approximation to the binomial distribution. is small, then the normal approximation isn’t very good. is large but
  is small, then the normal approximation isn’t very good. I’ll say in words that there is a decent approximation under this limit, namely the Poisson distribution, but (for a class in statistics) I won’t say much more than that.
Doubtlessly, there are equally good pedagogical tools for this purpose. However, at the time I was limited to Microsoft products, and it took me untold hours to figure out how to get Excel to draw the probability histogram. So I continue to use this spreadsheet in my classes to demonstrate to students this application of the Central Limit Theorem.