One of my favorite anecdotes that I share with my statistics students is why the Student t distribution is called the t distribution and not the Gosset distribution.
In the English-language literature it takes its name from William Sealy Gosset’s 1908 paper in Biometrika under the pseudonym “Student”. Gosset worked at the Guinness Brewery in Dublin, Ireland, and was interested in the problems of small samples, for example the chemical properties of barley where sample sizes might be as low as 3. One version of the origin of the pseudonym is that Gosset’s employer preferred staff to use pen names when publishing scientific papers instead of their real name, therefore he used the name “Student” to hide his identity. Another version is that Guinness did not want their competitors to know that they were using the t-test to test the quality of raw material.
Gosset’s paper refers to the distribution as the “frequency distribution of standard deviations of samples drawn from a normal population”. It became well-known through the work of Ronald A. Fisher, who called the distribution “Student’s distribution” and referred to the value as t.
From the 1963 book Experimentation and Measurement (see pages 68-69 of the PDF, which are marked as pages 69-70 on the original):
The mathematical solution to this problem was first discovered by an Irish chemist who wrote under the pen name of “Student.” Student worked for a company that was unwilling to reveal its connection with him lest its competitors discover that Student’s work would also be advantageous to them. It now seems extraordinary that the author of this classic paper on measurements was not known for more than twenty years. Eventually it was learned that his real name was William Sealy Gosset (1876-1937).
Every so often, I’ll publicize through this blog an interesting article that I’ve found in the mathematics or mathematics education literature that can be freely distributed to the general public. Today, I’d like to highlight “Vertically Integrating Professional Skills Throughout A Mathematics Major,” by Clarice Dziak, Brian Leventhal, Aaron Luttman, and Joseph Skufca. Here’s the abstract:
In response to a university mandate to include “professional issues” as a component of every major, we have developed a vertically integrated approach to incorporating the study of professional skills and issues into the mathematics curriculum. Beginning in the first year of study, mathematics majors take an inquiry-based course in mathematical modeling using software packages that are important in business and industry, such as Excel®, Maple®, and Matlab®. In the third year, students choose between a seminar course covering topics in teaching and another covering topics related to research and work in industry. The courses are designed to introduce students to the different cultures and issues of business, industry, and teaching. Beyond these two courses, students are required to demonstrate proficiency in three core areas through a required “professional experience,” which takes the form of an internship, undergraduate research experience, or educational outreach program.
Full reference:Clarice Dziak, Brian Leventhal, Aaron Luttman & Joseph Skufca (2014) Vertically Integrating Professional Skills Throughout A Mathematics Major, PRIMUS: Problems, Resources, and Issues in Mathematics Undergraduate Studies, 24:4,301-308, DOI:10.1080/10511970.2013.876472
As has been well publicized, tomorrow is the Pi Day of the Century (3/14/15). I actually know someone who intentionally planned her wedding for tomorrow morning at 9:26 am.
The North Branch of the Denton library will be holding a Pi Day event from 9:26 am until 5:35 pm, and I’ll be making four presentations (two for grade school children and two for teens/adults). You’re welcome to bring the family and enjoy as your schedule permits.
March 14, 2015 has been labeled the Pi Day of the Century because of the way this day is abbreviated, at least in America: 3/14/15.
I was recently asked an interesting question: did any of our ancestors observe Pi Day about 400 years ago on 3/14/1592? The answer is, I highly doubt it.
My first thought was that may not have been known to that many decimal places in 1592. However, a quick check on Wikipedia (see also here), as well as the book “ Unleashed,” verifies that my initial thought was wrong. In China, 7 places of accuracy were obtained by the 5th century. By the 14th century, was known to 13 decimal places in India. In the 15th century, was calculated to 16 decimal places in Persia.
It’s highly doubtful that the mathematicians in these ancient cultures actually talked to each other, given the state of global communications at the time. Furthermore, I don’t think any of these cultures used either the Julian calendar or the Gregorian calendar (which is in near universal use today) in 1592. (An historical sidebar: the Gregorian calendar was first introduced in 1582, but different countries adopted it in different years or even centuries. America and England, for example, did not make the switch until the 18th century.) So in China, India, and Persia, there would have been nothing particularly special about the day that Europeans called March 14, 1592.
However, in Europe (specifically, France), Francois Viete derived an infinite product for and obtained the first 10 digits of . According to Wikipedia, Viete obtained the first 9 digits in 1579, and so Pi Day hypothetically could have been observed in 1592. (Although Unleashed says this happened in 1593, or one year too late).
There’s a second problem: the way that dates are numerically abbreviated. For example, in England, this Saturday is abbreviated as 14/3/15, which doesn’t lend itself to Pi Day. (Unfortunately, since April has only 30 days, there’s no 31/4/15 for England to mark Pi Day.) See also xkcd’s take on this. So numerologically minded people of the 16th century may not have considered anything special about March 14, 1592.
The biggest obstacle, however, may be the historical fact that the ratio of a circle’s circumference and diameter wasn’t called until the 18th century. Therefore, both serious and recreational mathematicians would not have called any day Pi Day in 1592.
In my capstone class for future secondary math teachers, I ask my students to come up with ideas for engaging their students with different topics in the secondary mathematics curriculum. In other words, the point of the assignment was not to devise a full-blown lesson plan on this topic. Instead, I asked my students to think about three different ways of getting their students interested in the topic in the first place.
I plan to share some of the best of these ideas on this blog (after asking my students’ permission, of course).
This student submission comes from my former student Nada Al-Ghussain. Her topic, from Geometry: using a straightedge and compass to find the incenter of a triangle.
What interesting things can you say about the people who contributed to the discovery and/or the development of this topic?
Sitting down one day pondering, Greco-Roman mathematician Euclid had a light-bulb moment and Eureka, the Elements was created! Right? Well not quite. Back in the day, 440B.C to be exact, a merchant named Hippocrates of Chios, chased after pirates to Athens to recover his stolen property. Unsuccessful, he attended math lectures and compiled the first known work of elements in geometry. Later on, around 350 B.C in the Academy, mathematician Theudius’s textbook was used by non- other than Aristotle. Then came our man Euclid in 300 BC and presented to us the pivotal textbooks, the Elements, which was used in universities until the 20th century. Euclid had compiled previous mathematical work into his Elements although he alone contrived the design and construction of different parts. Euclid’s Elements consisted of 13 books that covered Euclidean geometry, elementary number theory, and etc. For example, in book 4 (IV) Proposition 4, Euclid gives directions to inscribe a circle in a given triangle using a straightedge and compass.
How could you as a teacher create an activity or project that involves your topic?
I would set up a Founding Geometry explore activity before telling students anything over Euclidean geometry. In this activity I would want individual work but allow students to discuss in groups. Each person would get an equilateral triangle image, a compass, and a straightedge, not a ruler! First I would instruct the students to find the incenter, middle point of the triangle using only those two tools. This would get the students to think and go through trial and error as they work individually and together. Next I would ask them to write down their steps and discuss with each other. Then I would open class discussion asking the students the steps they took to get the incenter. I would ask thee students if they see anything else with all the lines they drew. Hoping they would describe the angle bisectors. Then I would ask the class if all triangle incenter’s could be found the same way. I would give each student a different shaped and sized triangle and give them time to discover the answer on their own. Once students finished, I would discuss the class the key steps and definitions learned. I would then tell me that they all are founders of Geometry, and tell them about Euclid’s role in geometry. This activity could be easily changed to any parts like how to construct a triangle or even to help prove and understand the Pythagorean theorem.
How can technology be used to effectively engage students with this topic?
When constructing geometry, trial and error tends to occur. Whether it is an instructor or a student. Graphical Ruler and Compass Editor, GRACE is a great site that allows the user to construct using only a straightedge and compass. By simply producing points and picking from Line, Line Segment, Ray, Circle, Perpendicular Bisector, and Intersection. This could be given to students as they work in class or at home as to not waste paper. It has special features that allow you to zoom in and out doing multiple constructions on one page. It also allows you to create and test axioms. This is tool is great for middle school all the way to university level students. It’s a quick visual that can be manipulated easily. From experience, many times when constructing certain propositions from Euclid’s Elements, I tended to waste time erasing so much and making perfect circles. Plus hand drawings can be tedious for some students. This is easier to use and engage all students including some special education students.
In my capstone class for future secondary math teachers, I ask my students to come up with ideas for engaging their students with different topics in the secondary mathematics curriculum. In other words, the point of the assignment was not to devise a full-blown lesson plan on this topic. Instead, I asked my students to think about three different ways of getting their students interested in the topic in the first place.
I plan to share some of the best of these ideas on this blog (after asking my students’ permission, of course).
This student submission comes from my former student Kristin Ambrose. Her topic, from Geometry: introducing the terms parallelogram, rhombus, trapezoid, and kite.
How could you as a teacher create an activity or project that involves your topic?
An activity I could do with my students is to have my students sort the different shapes into their own categories. Without letting them know the terms for these shapes, I could give my students several cut-outs of different parallelograms, rhombi, trapezoids, and kites, and have them sort these into four categories. Then the students could discuss how they grouped the shapes, and with the teachers guidance the students would come up with a list of the key characteristics each group of shapes had. Only at the end would the teacher reveal the official terms (parallelogram, rhombus, trapezoid, and kite) for these categories, and by this point the students would already know the characteristics for each shape since they previously listed the characteristics before they knew the official terms. I believe this would make the process of learning about these shapes more meaningful and interesting since the students would have discovered the characteristics of these shapes on their own.
How has this topic appeared in high culture (art, classical music, theatre, etc.)?
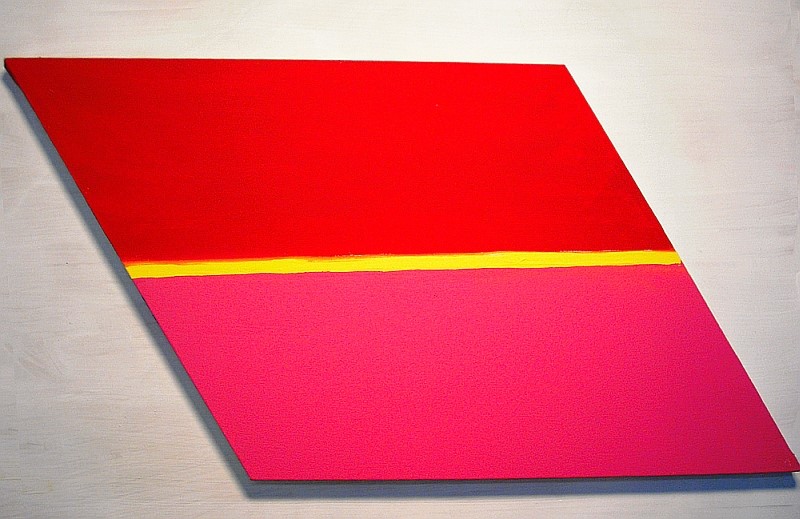
Geometry often appears in art, and therefore shapes like parallelograms, rhombi, trapezoids and kites can be found in pieces of artwork. I was able to find a website (http://fineartamerica.com/art/all/geometric/all) where they sell geometric artwork. On this site I was able to find a few pieces that contained parallelograms, rhombi, trapezoids, and kites. Here are a few pictures of artwork that contains these geometric shapes:
These shapes can also be found in other forms of art like jewelry, like this trapezoid necklace and kite earrings:
Students may find it interesting to see how geometric shapes can be used in different forms of art, and it may even inspire them to create their own forms of geometric artwork or crafts.
How can technology be used to effectively engage students with this topic?
On YouTube, the channel Vi Hart has a video where they create geometric shaped cookies. Here is the link to the video:
During the first two minutes of the video they create √2 rhombus cookies. Then they are able to create other cookie shapes using the rhombi cookie dough. It’s interesting to see the different ways they cook with the geometric shapes, and it could even inspire my students to create their own geometric-shaped cookies. After viewing the video, I could discuss with my students what characteristics they noticed about the rhombus-shaped cookies and this could open up a discussion about what the definition of a rhombus is. After discussing rhombi, we could move on to discussing other kinds of geometric shapes like parallelograms, trapezoids, and kites. We could also discuss the similarities between these kinds of shapes, and how they connect to each other.
In my capstone class for future secondary math teachers, I ask my students to come up with ideas for engaging their students with different topics in the secondary mathematics curriculum. In other words, the point of the assignment was not to devise a full-blown lesson plan on this topic. Instead, I asked my students to think about three different ways of getting their students interested in the topic in the first place.
I plan to share some of the best of these ideas on this blog (after asking my students’ permission, of course).
This student submission comes from my former student Kelley Nguyen. Her topic, from Geometry: translation, rotation, and reflection of figures.
How could you as a teacher create an activity or project that involves your topic?
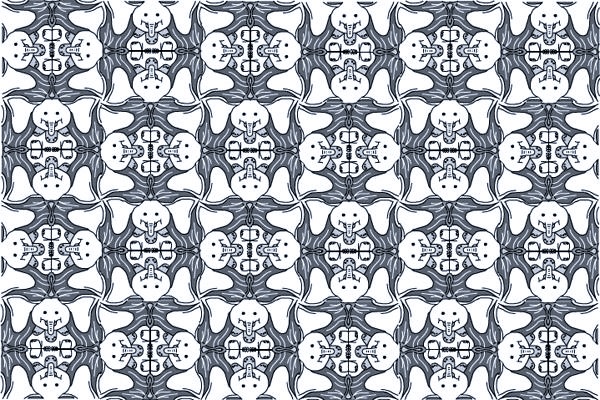
With this topic, I would definitely do an art activity, where students will construct tessellations of their choice. I would ask the students to print out a picture of their favorite animal, sport, pattern, etc. In class the following day, we would begin our drawings and the students will take the assignment home and finish it as a project. I would start them off in the top left corner, making a reflection of the original image. Then, we’ll turn the image 90 degrees, making a rotation of the original image. We’ll repeat this process until the entire page is complete. In this case, using an 8.5” x 11” sheet of computer paper may be the best choice so not too much time is spent on the art of the subject rather than the concepts behind it. If teachers wanted to make it an extra credit assignment, using a poster board can be a good idea and can be hung outside the classroom.
Once the students are complete with the project, we will all reflect on what they see. They’ll be able to point out the turns and flips of the tessellation, which will lead us into the topic of transformations.
How has this topic appeared in high culture (art, classical music, theatre, etc.)?
Translations, rotations, and reflections all appear in the art of dance. Being a dancer involves a lot of movement, including turns, flips, slides, etc. These types of movements are all connected to geometry.
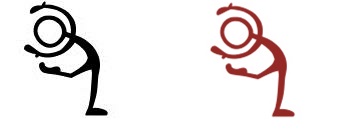
If a dancer spends an eight-count sliding from one space to another, this form of movement is considered a translation in mathematics. For example, in the picture below, the black character slides into the position of the red character. That is a form of translation with movement in dance.
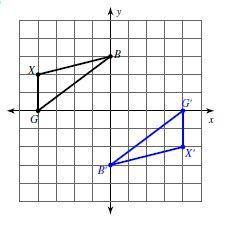
Mathematically, a translation will look like the image below, where the black triangle translates one unit down and five units to the right.
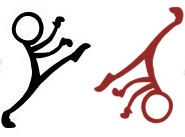
Now, if a dancer decides to throw a handstand into their routine, this is a form of reflection on the original position.
Mathematically, a rotation is done by a particular degree. The example below displays an object being rotated 180 degrees about the origin.
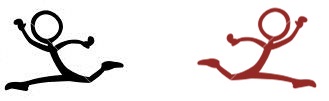
Lastly, let’s say two dancers perform a duet for an upcoming show. Most of their routine contains the same exact movements but in some point of their dance, both dancers reflect each other moves against each other. This form of movement is considered a reflection. For example, in the picture below, both dancers are reflected each other’s leaps away from each other, making a symmetric line down the middle.
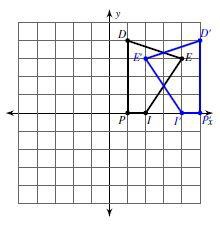
Mathematically, a reflection is a flipped image across the axis of symmetry. In the example below, the black figure is reflected across x = 3 to create the blue figure.
The examples provided are just some ways translations, rotations, and reflections are used in art of dance. Most people won’t pick up on the idea of mathematics being used when creating routines, but it’s definitely connected in many ways, movement being one.
How have different cultures throughout time used this topic in their society?
Transformations can be seen all over the world on streets, in museums, at parks, and downtown as works of art, architecture, crafts, and quilting.
Many transformational designs are found in rugs, quilts, buildings, and pottery from numerous different cultures. These designs gave note to where and to whom these unique pieces belongs to.
Most can agree that the use of transformations is important to art. These geometric designs showed a culture’s appeal of art and architecture. For example, historical buildings are well constructed and decorated to display religious beliefs or honor someone important in the community. These buildings often contain geometric shapes and patterns as an appeal to the population. Specifically, the Alhambra Palace in Spain portrays beautiful tessellation designs throughout its windows and ceilings. The designs are symbols of dynasty and wealth in their society.
Crafts and pottery also play a big role in the importance of transformations within cultures. When studying this form of art, researchers can identify which cultures interacted with other cultures. Each culture alone had their own unique designs that identify them as a whole, which portrayed their way of living and track the journey they took.
Lastly, thinking more modern, we could find that the United States Capitol building located in Washington, D.C. was built on the basis of symmetry. If you’ve ever been inside, you’ll notice that the building contains a lot of interior art work, including tessellations and symbols representing important historical people and events. References
This spring, tests developed by the Smarter Balanced Assessment Consortium will be administered to well over 10 million students in 17 states to determine their proficiency on the Common Core Standards for Mathematics (CCSSM). This analysis of mathematics test questions posted online by Smarter Balanced reveals that, question after question, the tests:
• Violate the standards they are supposed to assess;
• Cannot be adequately answered by students with the technology they are required to use;
• Use confusing and hard-to-use interfaces; or
• Are to be graded in such a way that incorrect answers are identified as correct and correct answers as incorrect.
No tests that are so flawed should be given to anyone. Certainly, with stakes so high for students and their teachers, these Smarter Balanced tests should not be administered. The boycotts of these tests by parents and some school districts are justified. Responsible government bodies should withdraw the tests from use before they do damage.
The full report is 34 pages long, giving example after example of horribly written test questions. This example was my personal favorite:
Question 2: A circle has its center atand goes through the point. A second circle is tangent to the first circle at the pointand has the same area. What are the possible coordinates for the center of the second circle? Show your work or explain how you found your answer.
In Question 2, the test makers ask students to solve a geometric problem and show their work. In general, asking students to show their work is a good way to understand their thinking. In this case, would anyone begin the problem by not sketching a picture of the circles? I doubt it. I certainly started by drawing a picture. A simple sketch is the most appropriate way to show one’s work. However, there’s just one major issue: There is no way to draw or submit a drawing using the problem’s “technology-enhanced” interface! So a student working on this problem is left with a problem more vexing than the mathematical task at hand—“How do I show my picture by typing words on a keyboard?”
I highly recommend reading the report in its entirety.
In my capstone class for future secondary math teachers, I ask my students to come up with ideas for engaging their students with different topics in the secondary mathematics curriculum. In other words, the point of the assignment was not to devise a full-blown lesson plan on this topic. Instead, I asked my students to think about three different ways of getting their students interested in the topic in the first place.
I plan to share some of the best of these ideas on this blog (after asking my students’ permission, of course).
This student submission comes from my former student Donna House. Her topic, from Geometry: deriving the distance formula.
What interesting word problems using this topic can your students do now?
Start with a story:
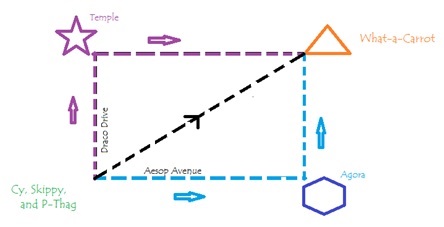
Two guys (Cyniscus and Protogenes, but they usually went by their nicknames, Cy and Skippy) were hanging out on a Saturday afternoon in ancient Greece. Cy wanted to go to McDolops and get a Filet-O-Squid, but Skippy wanted to go to Athens Fried Pheasant. While they were discussing this, their buddy, Pythagoras, walked by.
Cy: Hey, P-Thag! What up? (This is from the original Greek.)
Pythagoras: Dude! Just gonna grab a bite somewhere. What up with y’all? (Greece is in the south.)
Cy and Skippy told P-Thag about trying to decide where to go. Pythagoras did not want to go to either place — McDolops or Athens Fried Pheasant — because he was a vegetarian. (Pythagoras was also morally opposed to beans. No one knows exactly why. Some say it was because he believed eating beans was akin to eating people. Others think it was because — well, you know what eating beans does.)
So, Pythagoras suggested they go to What-a-carrot and, since they served pomegranates and pancakes, Cy and Skippy thought that was a great idea. But how would they get there?
Cy wanted to walk east down Aesop Avenue to the agora, turn left, and walk to What-a-carrot.
Skippy wanted to walk north up Draco Drive to the temple, turn right, and walk to What-a-carrot.
Pythagoras had more common-sense (or was just lazy) and wanted to find a shorter route. So, he came up with a useful theorem on the spot! (Really – that is just how it happened.) P-Thag wanted to walk straight to What-a-carrot. (Euclid wrote an axiom for this: “Given two points there is one straight line that joins them.” Euclid’s axiom didn’t help on this day – Euclid lived about 300 years later!)
If Aesop Avenue is 4 stadia long and Draco Drive is 3 stadia long, how far would they walk using Cy’s route? How far would they walk using Skippy’s route? How far would they walk using P-Thag’s route?
It is late and you are sitting at your desk and in the middle of planning your new tower project or antenna support [you are a ham-radio operator] and you’re getting all of the materials, parts, accessories list, etc. together so you can dig deep into your bank account for the needed money to purchase all of the needed supplies.
In your excitement you realize you just can’t wait to get that antenna support mast or that tower you just acquired high in the air so your signal will travel the earth and beyond.
In your planning stage you have looked over your proposed tower or mast site and found the ideal place in which to “plant” it in the ground and you know how high it will be when it is installed.
Now you ask yourself where to put the guy wires for it on the ground…you walk around the area and pick some good locations for each of them hopefully conforming to recommended safe installation procedures. In your observations, you realize that each guy wire will have to be a different length due to obstructions and Murphy’s Law getting in the way. It never fails, Murphy is always looking over our shoulders and picking on us as ham radio operators!
Ok now, stand back Murphy…each guy wire has to go in a specific location whether “Murphy” likes it or not and you know how high the tower or support mast, pole, etc. is so then it hits you… and you ask yourself….how long will the guys [wires] have to be for the locations I have picked out? I don’t want to have to buy more guy wire than I need. After all, my wife says I am cheap!
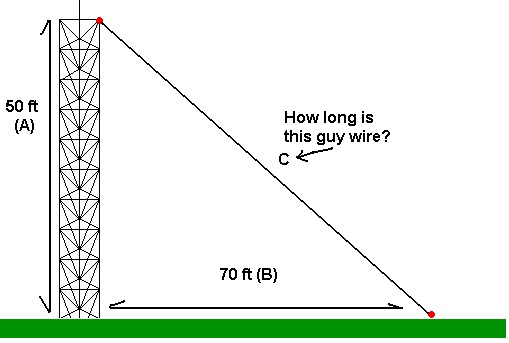
You look at the tower, pole, mast etc. and your location for the guy wire at ground level and say….well the mast is 50 feet tall, so the length at the location of my first guy has to be at least as long as the mast is high but a bit longer…but how much longer will it have to be due to the angle of the guy coming off of the tower if it is 70 feet away? See the example drawing below for our proposed setup and to get the answer to our question in our fictitious installation.
In our example above, the tower is 50 feet from the base to the top guy
attachment point and the distance to the first guy is 70 feet…how long is the guy wire!
How could you as a teacher create an activity or project that involves your topic?
Math can become boring and tedious for some students (shocking! – I know.) An activity that will help them learn while having fun will help them remember the lesson. One such activity is useful in learning the distance formula.
If your classroom is not large enough, arrange to have your lesson outdoors or in the gym (at least this portion of the lesson.) Divide the students into two teams and have each team line up in an “L” shape. For example, if you have 10 students on a team, have six or seven line up in a straight line and the remaining students form a line at a right angle to the end of the first line. The number of students in each line is not important as long as the lines form a right angle and each team is lined up the same way.
Give the two students at one end of each team a ball and tell them to pass the ball from one student to the next until the ball reaches the end of the line. The goal is to pass the ball from one side of the team to the other. The team who passes the ball fastest wins the match.
Repeat this game until someone figures out to throw the ball from one end of the line to the other. (You may need to say, “Think about how you can get the ball to the other end faster.”) This will complete your right triangle!
Now you can have a discussion about how going from one end to the other directly is faster than having to go around the corner. (The shortest distance between two points . . .) Someone will probably mention the Pythagorean Theorem and that will give you the perfect opportunity to guide them through the derivation of the distance formula!
Begin by asking, “How can not knowing math cost you money?” Pause to give the students a moment to think about the question, then say, “Let’s see what happened to a contestant on Who Wants to be a Millionaire?”
Pause the video between 1:00 and 1:05 (before the audience’s answers are revealed) and have the class vote for the answer they think is correct. Don’t give the students too much time to think – you should simulate the time the contestant has to answer (about a minute.) Tally the votes on the board (and find the percentages) so the class can see the results. Compare the class percentages with the audience percentages. Now resume the video.
Stop the video at 2:18 so the correct answer is given, but the smaller squares are not yet revealed. Say, “Would you have lost $15,000 on this question like this contestant did? How do we know that 25 is the correct answer?” Help the students set up the problem.
25 (which is a square) is equal to (something squared) + (something squared)
So, 25 = x2 +y2
So, 52 = x2 +y2
“What formula is this?” [a circle]
“What does 52 represent?” [radius squared]
At this point you can draw the circle and the radius, then discuss how to find x2 and y2. This will lead to the formula for the Distance Formula!


 may not have been known to that many decimal places in 1592. However, a quick check on





 and goes through the point
 . A second circle is tangent to the first circle at the point