In my capstone class for future secondary math teachers, I ask my students to come up with ideas for engaging their students with different topics in the secondary mathematics curriculum. In other words, the point of the assignment was not to devise a full-blown lesson plan on this topic. Instead, I asked my students to think about three different ways of getting their students interested in the topic in the first place.
I plan to share some of the best of these ideas on this blog (after asking my students’ permission, of course).
This student submission again comes from my former student Marissa Arevalo. Her topic, from Algebra: adding and subtracting a mixture of positive and negative integers.

How could you as a teacher create an activity or project that involves your topic?
An activity written by Kim Claryon The National Council of Teachers of Mathematics involves students understanding what it means when adding a negative integer, subtracting a positive integer, etc. This activity is called Zip, Zilch, Zero. Students are set in a group of 3 to 4 and dealt seven cards each, where the rest of the cards are left as a draw pile with a single card in the discard pile. Red cards are negative values and black cards are positive where Ace is equal to one, Jack is equal to eleven, Queen is equal to twelve, and King is equal to thirteen. Each student must draw a card from the top of the draw/discard pile. The point of the game is to add cards together to make a “Zip” or equal zero. the object of the game is that when a player plays the last card in their hand, all of the hands are scored by subtracting the absolute value of the sum of the cards in the hands from the absolute value of the cards played in a “Zip”. The winner has the highest score. Do note that the rules may be very tricky to understand as first and should be read aloud in class to help the games to go smoothly. Rules can be found on the website given below.
How has this topic appeared in high culture (art, classical music, theatre, etc.)?
In a lot of idealizations of math by students, they do not associate STEM subjects with that of art. However, as a student who likes to paint and draw, I know that the arts involve a lot of mathematical logic in its creation, so one way to get the students involved, is to show that math is in everything. Therefore, I found a website with a video that discusses positive and negative space in a picture. In the video there is a black and white image of a tree on a flat landscape without anything in the background. The white space of the photo is referred to as the negative space and the black is the positive space as it is the subject and area of interest. In the video, the narrator describes that as the image is made smaller and larger that the value of the negative and positive space increases or decreases.

This can be a great engage as far as to asking the students to observe what happens when you make the subject area smaller or larger and whether or not that means if the negative space has decreased or increased. This could lead to a discussion as to how this relates to numbers and how the values of an integer change based on adding or subtracting from it.
How can technology (YouTube, Khan Academy [khanacademy.org], Vi Hart, Geometers Sketchpad, graphing calculators, etc.) be used to effectively engage students with this topic?
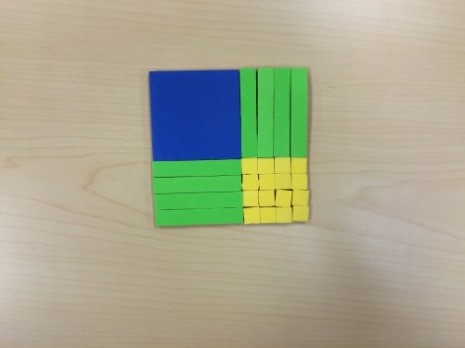
A video I found on a blog “Embrace the Drawing Board” when I was looking through Pinterest had a very entertaining video that demonstrates what happens when adding or subtracting positive and negative integers. On the video the positive integers were green army men and the negative integers were red army men that were fighting in a “War of the Integers”. For example, in each battle, an equal amount of red and green army men will die on both sides when combining, or adding, the red and green men onto the battle field.
This is a great beginning to a sort of game between the students in which two students can play with one as the negative army and the other as the positive army. They can take turns to roll a pair of die where that number is the number of army they are brining to battle. Both students take turns deciding whose value goes first in the equation and then constructs the equations on a sheet of paper to figure out which side won the battle. Then, after about five to ten minutes of addition, the operation switches to subtraction, and the students continue to switch in whose number goes where in the equations.
_____ + ______ = ________
_____ — ______ = ________
Afterwards the teacher allow a student lead discussion by asking them what happened when subtracting a negative, adding a negative, etc. Then students can create their own theories and develop their own theories as to why they happened before the teacher can address any misconceptions.
References:
Click to access ZZZ-AS-RulesandRecord.pdf
http://thevirtualinstructor.com/positive-and-negative-space.html
http://mrpiccmath.weebly.com/blog/category/lesson%20ideas
 or
or  ) can be found by using the formula (Observed – Expected)/(Standard Error), where the standard error formula has changed, and the critical values of the normal or
  ,
, ,
, .
.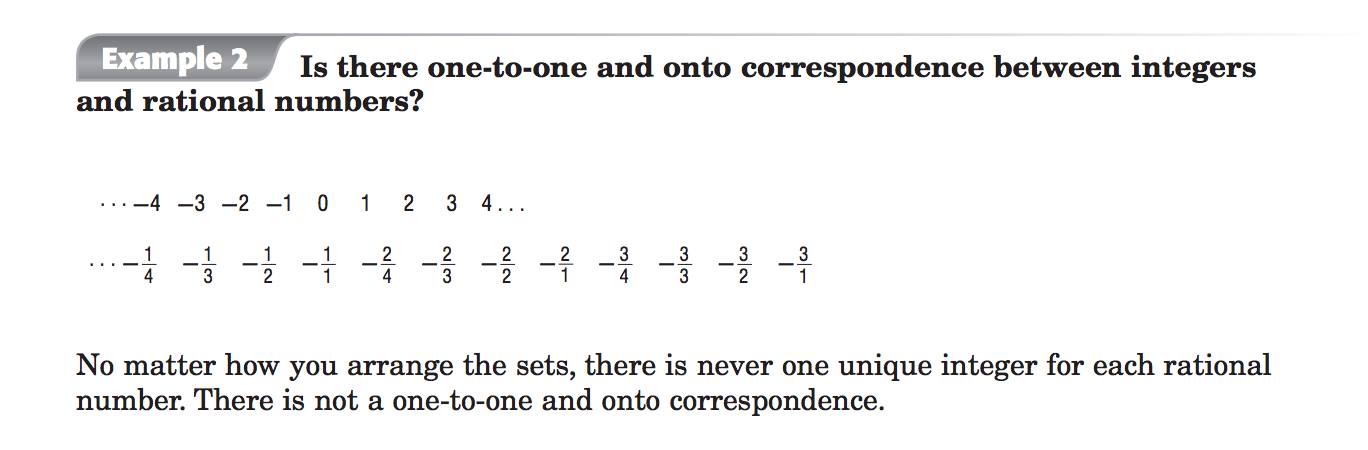
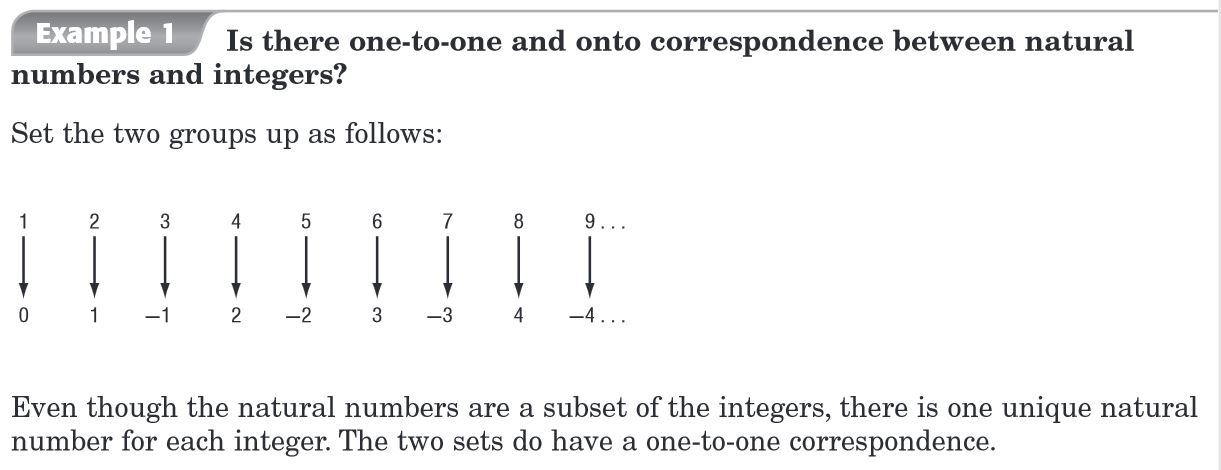
 is most definitely a countable set, and so there is a one-to-one and onto correspondence between integers and rational numbers. See
  .
. . If the authors had double-checked this proof in any reputable book, they should have also been able to double-check that their Example 2 was completely false.