It’s 2016, which means it’s another election year. Here’s a very nice article from the last campaign cycle about the bipartisan abuse of statistics to mislead: http://www.washingtonpost.com/blogs/the-fix/wp/2014/10/30/graphs-can-be-made-to-show-anything-campaign-ads-edition/?tid=sm_fb
Category: Statistics
Not Even Scientists Can Easily Explain P-Values
FiveThirtyEight.com published a very interesting feature: asking some leading scientists at a statistics conference to explain a P-value in simple, nontechnical terms. While they all knew the technical definition of a P-value, they were at a loss as to how to explain this technical notion to a nontechnical audience.
I plan on showing this article (and the embedded video) to my future statistics classes.
Engaging students: Fitting data to a quadratic function
In my capstone class for future secondary math teachers, I ask my students to come up with ideas for engaging their students with different topics in the secondary mathematics curriculum. In other words, the point of the assignment was not to devise a full-blown lesson plan on this topic. Instead, I asked my students to think about three different ways of getting their students interested in the topic in the first place.
I plan to share some of the best of these ideas on this blog (after asking my students’ permission, of course).
This student submission again comes from my former student Loc Nguyen. His topic, from Algebra: fitting data to a quadratic function.

A1. What interesting (i.e., uncontrived) word problems using this topic can your students do now?
To engage students on this topic, I will provide them the word problems in the real life so they can see the usefulness of quadratic regression in predictive purposes. The question to the problem is about the estimated numbers of AIDS cases that can be diagnosed in 2006. The data only show from 1999 to 2003. This will be students’ job to figure out the prediction. I will provide the instructions for this task and I will also walk them through the process of finding the best curve that fit the given data. The best fit to the curve will give us the estimation. Here is how the instruction looks like:

In the end, students will be able to acquire the parabola curve which fit the given data. By letting students work through the real life problems, they will be able to understand why mathematics is important and see how this concept is useful in their lives.
B2. How does this topic extend what your students should have learned in previous courses?
Before getting into this topic, the students should have eventually been familiar with the word “quadratic” such as quadratic function, quadratic equation. Students should have been taught when the curve concaves up or down. In the previous course, students would be given the quadratic functions and they would be asked to find the maxima, minima, or intercepts. Or they would be asked to solve the quadratic equation and find the roots. The universal properties of quadratic function never change. When students encountered the concept of quadratic regression, they would not be so overwhelmed with the topic. There is no new rule or properties. The process is just backward. The Instead of having the given function, in this case, students will have to find the function based on the given data so that the curve would fit the data. Their prior knowledge is really essential for this topic, and this would help them to understand the concept of quadratic regression easier.
C1. How has this topic appeared in pop culture (movies, TV, current music, video games, etc.)?
At the beginning of the class, I would like to show students the short video of football incident.
This incident was really interesting. The Titans punt went so high so that it hit the scoreboard in Cowboys stadium. Surprisingly, this was Cowboy’s new stadium. There were many questions about what was going on when the architecture built this stadium. It was supposed to be great. This incident revealed the errors in predicting the height of the scoreboard. The data they collected in past year may have been incorrect. I want to incorporate this incident into the concept of quadratic regression. I will pose several questions such as:
Was Titan football punter really that powerful? What was really wrong in this situation?
When the architectures built this stadium, did they ever think that the ball would reach the ceiling?
How come did the architectures fail to measure the height of the ceiling? Did they just assume the height of the stadium tall enough?
What was the path of the ball?
Students will eagerly respond to these questions, and I will slowly bring in the important of quadratic regression. I will then explain how quadratic regression helps us to predict the height based on collected data from past years.
References:
https://www.youtube.com/watch?v=V4N3LEi5a1Q
http://www.algebralab.org/Word/Word.aspx?file=Algebra_QuadraticRegression.xml
Engaging students: Approximating data by a straight line
In my capstone class for future secondary math teachers, I ask my students to come up with ideas for engaging their students with different topics in the secondary mathematics curriculum. In other words, the point of the assignment was not to devise a full-blown lesson plan on this topic. Instead, I asked my students to think about three different ways of getting their students interested in the topic in the first place.
I plan to share some of the best of these ideas on this blog (after asking my students’ permission, of course).
This student submission again comes from my former student Esmerelda Sheran. Her topic, from Algebra: approximating data by a straight line.
A.2) How could you as a teacher create an activity or project that involves your topic?
If I created an activity for my class over approximating data by using a straight line I would make sure the type of data, they use is something that is relevant or interesting in the student’s lives. I would have the students work in pairs and choose the data they would work with out of three sets of data I have chosen. Examples of the choices of data would be the relationships between interceptions and wins for NFL teams, car accidents and age, or attendance and GPA (in college/universities). Using the data they chose the students would first take an educated guess of how the graph would look like, draw the scatter plot associated with the data, and compare their guess to the actual graph. At that point the students would try to identify the parent function (xb+c, mx+b, ab, ln(x) etc.) that the data is most similar to or if the data even has correlation. They would then draw what they believed the best fit line would look like on the scatterplot which they would compare to the linear regression once they calculated it on a graphing calculator. I would hope that this activity would be interesting due to the data being real and relatable as well as it being a way to connect parent functions and statistical data.
D.1) What interesting things can you say about the people who contributed to the discovery and/or the development of this topic?
Two of the main collaborators of linear regression are Sir Francis Galton and Karl Pearson. Galton was the discoverer of the linear regression and Pearson further elaborated on Galton’s ideas. Linear regression actually came to be because of sweet peas, Galton was studying heredity in sweet peas and formulated linear regression to aid him in studying the relations he found in his studies. Galton was much more than a hereditist, he was a geologist, meteorologist, tropical explorer, founder of differential psychology, inventor of fingerprint identifications, and an author. A few more interesting things about Galton is that he was knighted, he was accused of promoting eugenics, he was British and he was a half cousin of Charles Darwin. If you were wondering what “eugenics” is, it is the idea of planned breeding of humans through selectively breeding and sterilization. Galton once said, “… I object to pretensions of natural equality.” Being that Galton studied heredity it is no wonder that he felt that some physical/mental/emotional attributes where superior and that humans would benefit from having the “best” genes. Unfortunately for Galton eugenics was frowned upon and he was attacked for promoting it. I think that students would find Galton extremely interesting because of his wide variety of interests.
Karl Pearson, although not as complex as Galton had a few attributes that I feel would interest students. Pearson did not have a childhood that would be considered normal in modern day. Pearson was homeschooled up until he turned nine, and then he went to London alone to study at the University of College School. After he received his degrees and studied physics, metaphysics and Darwinism, Pearson developed his own view in social Darwinism. The social beliefs, he developed led him to changing his name from Carl to Karl.
E.1) How can technology be used to effectively engage students with this topic?
Technology in the classroom has and always will be an effective way to engage students if used correctly. To engage my students to learn how to approximated data with a straight line I would use excel, a smartboard, or the khan academy website. Excel is a useful piece of technology that is underappreciated by the average Joe. With a set of data you can record the relationships and then use the tools to create a scatterplot and then find the linear regression line on the graph.
Using a smartboard in the classroom is effective because it is new technology that is very special and kind of rare. Using smartboard to graph the points of data and then drawing an approximated regression line is highly kinesthetic and gives hands-on experiences instead of just typing in number and getting a calculated result that required almost no brain power. Kinesthetically moving their arms up, down, or side to side helps the students get a feel for the variation and relations between the data and drawing a best fit line themselves help the student understand the data on a different level. The Khan Academy website is a great resource for being introduced and even mastering the concept of linear regression because of the different activities available. For visual and auditory learners, there are a series of videos that explain approximating data by linear regression as well as how to be the most accurate when approximating. Similarly, there is an activity for kinesthetic learners in which they can move a line around to see which line seems most like the best fit line. It is beneficial from an instructor to use this website to help students of all learning types.
References
http://www.mirror.co.uk/news/uk-news/elderly-priest-found-dead-after-5099110
https://www.dartmouth.edu/~matc/math5.geometry/unit2/unit2.html
http://geomhistory.com/home.html
http://www.americanegypt.com/feature/cities/chichenitza/castillo_shadow.htm
https://explorable.com/greek-geometry
New England Patriots Cheat At the Pre-Game Coin Flip? Not Really.
Last November, CBS Sports caused a tempest in a teapot with an article with the sensational headline “Patriots have no need for probability, win coin flip at impossible rate.” From the opening paragraphs:
Bill Belichick is never unprepared. Or at least that’s the perception. When other coaches struggle with when to use timeouts or how to manage the clock, the Patriots coach, almost effortlessly, always seems to make the right decision.
Belichick has also been extremely lucky. The Pats have won the coin toss 19 of the last 25 times, according to the Boston Globe‘s Jim McBride.
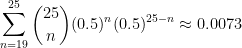
For some perspective: Assuming the coin toss is a 50/50 proposition, the probability of winning it at least 19 times in 25 tries is 0.0073. That’s less than three-quarters of one percent.
As far as the math goes, the calculation is correct. Using the binomial distribution,
Unfortunately, this is far too simplistic an analysis to accuse someone of “winning the coin flip at an impossible rate.” Rather than re-do the calculations myself, I’ll just quote from the following article from the Harvard Sports Analysis Collective. The article begins by noting that while the Patriots may have been lucky the last 25 games, it’s not surprising that some team in the NFL was lucky (and the lucky team just happened to be the Patriots).
But how impossible is it? Really, we are interested in not only the probability of getting 19 or more heads but also a result as extreme in the other direction – i.e. 6 or fewer. That probability is just 2*0.0073, or 0.0146.
That is still very low, however given that there 32 teams in the NFL, the probability of any one team doing this is much higher. To do an easy calculation we can assume that all tosses are independent, which isn’t entirely true as when one team wins the coin flip the other team loses. The proper way to do this would be via simulation, but assuming independence is much easier and should yield pretty similar results. The probability of any one team having a result that extreme, as shown before, is 0.0146. The probability of a team NOT having a result that extreme is 1-0.0146 = 0.9854. The probability that, with 32 teams, there is not one of them with a result this extreme is 0.985432 = 0.6245998. Therefore, with 32 teams, we would expect at least one team to have a result as extreme as the Patriots have had over the past 25 games 1- 0.6245998 = 0.3754002, or 37.5% of the time. That is hardly significant. Even if you restricted it to not all results as extreme in either direction but just results of 19 or greater, the probability of one or more teams achieving that is still nearly 20%.
The article goes on to note the obvious cherry-picking used in selecting the data… in other words, picking the 25 consecutive games that would make the Patriots look like they were somehow cheating on the coin flip.
In addition the selection of looking at only the last 25 games is surely a selection made on purpose to make Belichick look bad. Why not look throughout his career? Did he suddenly discover a talent for predicting the future? Furthermore, given the length of Belichick’s career, we would almost expect him to go through a period where he wins 19 of 25 coin flips by random chance alone. We actually simulate this probability. Given that he has coached 247 games with the Patriots, we can randomly generate a string of zeroes and ones corresponding to lost and won con flips respectively. We can then check the string for a sequence of 25 games where there was 19 or more heads. I did this 10,000 times – in 38.71% of these simulations there was at least one sequence with 19 or more heads out of 25.
The author makes the following pithy conclusion:
To be fair, the author of this article did not seem to insinuate that the Patriots were cheating, rather he was just remarking that it was a rare event (although, in reality, it shouldn’t be as unexpected as he makes it out to be). The fault seems to rather lie with who made the headline and pubbed it, although their job is probably just to get pageviews in which case I guess they succeeded.
At any rate, the Patriots lost the coin flip in the 26th game.
What Happens if the Explanatory and Response Variables Are Sorted Independently?
From the category “I Can’t Believe What I Just Read,” the following question was posed to a question-and-answer statistics board last month:
Suppose we have data set
with
points. We want to perform a linear regression, but first we sort the
values and the
values independently of each other, forming data set
. Is there any meaningful interpretation of the regression on the new data set? Does this have a name?
I imagine this is a silly question so I apologize, I’m not formally trained in stats. In my mind this completely destroys our data and the regression is meaningless. But my manager says he gets “better regressions most of the time” when he does this (here “better” means more predictive). I have a feeling he is deceiving himself.
The answers were priceless:
Your intuition is correct: the independently sorted data have no reliable meaning because the inputs and outputs are being randomly mapped to one another rather than what the observed relationship was.
There is a (good) chance that the regression on the sorted data will look nice, but it is meaningless in context.
And:
If you want to convince your boss, you can show what is happening with simulated, random, independent x,y data. With R:
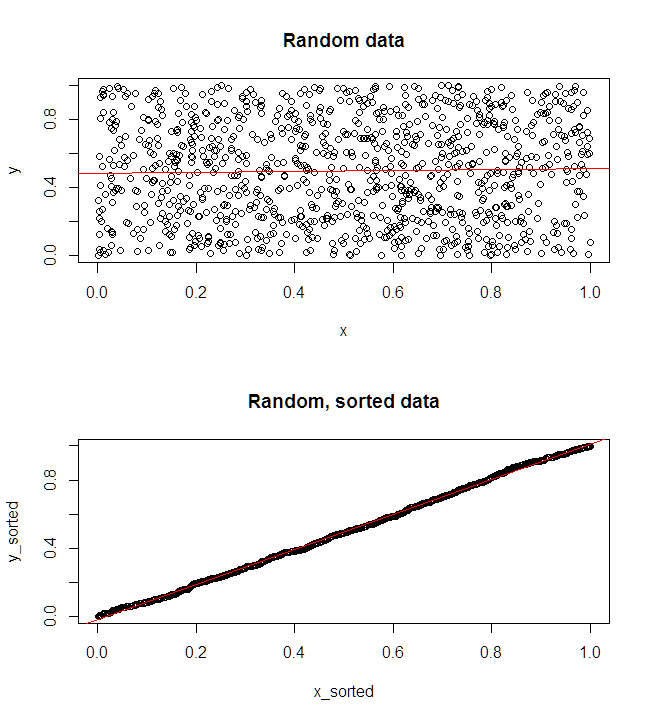
And:
This technique is actually amazing. I’m finding all sorts of relationships that I never suspected. For instance, I would have not have suspected that the numbers that show up in Powerball lottery, which it is CLAIMED are random, actually are highly correlated with the opening price of Apple stock on the same day! Folks, I think we’re about to cash in big time. 🙂
The sad end of the story, from the original poster:
Thank you for all of your nice and patient examples. I showed him the examples by @RUser4512 and @gung and he remains staunch. He’s becoming irritated and I’m becoming exhausted. I feel crestfallen. I want my work to mean something. I will probably begin looking for other jobs soon.
The Inspection Paradox
From http://allendowney.blogspot.com/2015/08/the-inspection-paradox-is-everywhere.html:
Airlines complain that they are losing money because too many flights are nearly empty. At the same time passengers complain that flying is miserable because planes are too full. They could both be right. When a flight is nearly empty, only a few passengers enjoy the extra space. But when a flight is full, many passengers feel the crunch.Once you notice the inspection paradox, you see it everywhere. Does it seem like you can never get a taxi when you need one? Part of the problem is that when there is a surplus of taxis, only a few customers enjoy it. When there is a shortage, many people feel the pain.
This article gives multiple examples (including computations) of the Inspection Paradox (also known as the Friendship Paradox), meaning that even the simple concept of “average” can be a little elusive. See also http://www.technologyreview.com/view/523566/how-the-friendship-paradox-makes-your-friends-better-than-you-are/
Correlation is not Causation (Part 4)
One of the standard topics in an undergraduate statistics course is the principle that two things that are highly correlated do not necessarily have a cause-and-effect relationship. Here is a hilarious example of this fallacy.
And, in case you’re wondering, here’s the rest of the story:
Interpreting statistical significance

Source: http://www.xkcd.com/1478/
Deciphering recommendation engines
From the video’s description: “Data scientist Cathy O’Neil provides a glimpse of the methods that Netflix, Google, and others apply to recommend or offer to users selections based on their apparent interests.” This is a non-intuitive but real application of linear algebra.
