Lessons from teaching gifted elementary school students (Part 3b)

Every so often, I’ll informally teach a class of gifted elementary-school students. I greatly enjoy interacting with them, and I especially enjoy the questions they pose. Often these children pose questions that no one else will think about, and answering these questions requires a surprisingly depth of mathematical knowledge.

Here’s a question I once received:

Suppose

A \times A = B

B \times B \times B = C

C \times C \times C \times C= D

If the pattern goes on, and if A = 2, what is Z?

In yesterday’s post, we found that the answer was

Z =2^{26!} =  10^{26! \log_{10} 2} \approx 10^{1.214 \times 10^{26}},

a number with approximately 1.214 \times 10^{26} digits.

How can we express this number in scientific notation? We need to actually compute the integer and decimal parts of 26! \log_{10} 2, and most calculators are not capable of making this computation.

Fortunately, Mathematica is able to do this. We find that

Z \approx 10^{121,402,826,794,262,735,225,162,069.4418253767}

\approx 10^{0.4418253767} \times 10^{121,402,826,794,262,735,225,162,069}

\approx 2.765829324 \times 10^{121,402,826,794,262,735,225,162,069}

Here’s the Mathematica syntax to justify this calculation. In Mathematica, \hbox{Log} means natural logarithm:

bigexponent

Again, just how big is this number? As discussed yesterday, it would take about 12.14 quadrillion sheets of paper to print out all of the digits of this number, assuming that Z was printed in a microscopic font that uses 100,000 characters per line and 100,000 lines per page. Since 250 sheets of paper is about an inch thick, the volume of the 12.14 quadrillion sheets of paper would be

1.214 \times 10^{16} \times 8.5 \times 11 \times \displaystyle \frac{1}{250} \hbox{in}^3 \approx 1.129 \times 10^{17} \hbox{in}^3

By comparison, assuming that the Earth is a sphere with radius 4000 miles, the surface area of the world is

4 \pi (4000 \times 5280 \times 12) \hbox{in}^2 \approx 8.072 \times 10^{17} \hbox{in}^2.

Dividing, all of this paper would cover the entire world with a layer of paper about 0.14 inches thick, or about 35 sheets deep. In other words, the whole planet would look something like the top of my desk.

green lineWhat if we didn’t want to print out the answer but just store the answer in a computer’s memory? When written in binary, the number 2^{26!} requires…

26! bits of memory, or…

about 4.03 \times 10^{26} bits of memory, or…

about $latex 5.04 \times 10^{25} bytes of memory, or …

about 5.04 \times 10^{13} terabytes of memory, or…

about 50.4 trillion terabytes of memory.

Suppose that this information is stored on 3-terabyte external hard drives, so that about 50.4/3 = 16.8 trillion of them are required. The factory specs say that each hard drive measures 129 \hbox{mm} \times 42 \hbox{mm} \times 167 \hbox{mm}. So the total volume of the hard drives would be 1.52 \times 10^{19} \hbox{mm}^3, or 15.2 \hbox{km}^3.

By way of comparison, the most voluminous building in the world, the Boeing Everett Factory (used for making airplanes), has a volume of only 0.0133 \hbox{km}^3. So it would take about 1136 of these buildings to hold all of the necessary hard drives.

The cost of all of these hard drives, at $100 each, would be about $1.680 quadrillion. So it’d be considerably cheaper to print this out on paper, which would be about one-seventh the price at $242 trillion.

Of course, a lot of this storage space would be quite repetitive since 2^{26!}, in binary, would be a one followed by 26! zeroes.

Lessons from teaching gifted elementary school students (Part 3a)

Every so often, I’ll informally teach a class of gifted elementary-school students. I greatly enjoy interacting with them, and I especially enjoy the questions they pose. Often these children pose questions that no one else will think about, and answering these questions requires a surprisingly depth of mathematical knowledge.

Here’s a question I once received:

Suppose

A \times A = B

B \times B \times B = C

C \times C \times C \times C= D

If the pattern goes on, and if A = 2, what is Z?

I leave a thought bubble in case you’d like to think this. (This is significantly more complicated to do mentally than the question posed in yesterday’s post.) One way of answering this question appears after the bubble.

green_speech_bubble

Let’s calculate the first few terms to try to find a pattern:

B = 2 \times 2 = 2^2

C = 2^2 \times 2^2 \times 2^2 = 2^6

D = 2^6 \times 2^6 \times 2^6 \times 2^6 = 2^{24}

etc.

Written another way,

A = 2^1 = 2^{1!}

B = 2^{2!}

C = 2^{3!}

D = 2^{4!}

Naturally, elementary school students have no prior knowledge of the factorial function. That said, there’s absolutely no reason why a gifted elementary school student can’t know about the factorial function, as it only consists of repeated multiplication.

Continuing the pattern, we see that Z = 2^{26!}. Using a calculator, we find Z \approx 2^{4.032014611 \times 10^{26}}.

If you try plugging that number into your calculator, you’ll probably get an error. Fortunately, we can use logarithms to approximate the answer. Since 2 = 10^{\log_{10} 2}, we have

Z = \left( 10^{\log_{10} 2} \right)^{4.032014611 \times 10^{26}} = 10^{4.032014611 \times 10^{26} \log_{10} 2}

Plugging into a calculator, we find that

Z \approx 10^{1.214028268 \times 10^{26}} = 10^{121.4028628 \times 10^{24}}

We conclude that the answer has more than 121 septillion digits.

How big is this number? if Z were printed using a microscopic font that placed 100,000 digits on a single line and 100,000 lines on a page, it would take 12.14 quadrillion pieces of paper to write down the answer (6.07 quadrillion if printed double-sided). If a case with 2500 sheets of paper costs $100, the cost of the paper would be $484 trillion ($242 trillion if double-sided), dwarfing the size of the US national debt (at least for now). Indeed, the United States government takes in about $3 trillion in revenue per year. At that rate, it would take the country about 160 years to raise enough money to pay for the paper (80 years if double-sided).

And that doesn’t even count the cost of the ink or the printers that would be worn out by printing the answer!

Engaging students: Using right-triangle trigonometry

In my capstone class for future secondary math teachers, I ask my students to come up with ideas for engaging their students with different topics in the secondary mathematics curriculum. In other words, the point of the assignment was not to devise a full-blown lesson plan on this topic. Instead, I asked my students to think about three different ways of getting their students interested in the topic in the first place.

I plan to share some of the best of these ideas on this blog (after asking my students’ permission, of course).

This student submission comes from my former student Shama Surani. Her topic, from Precalculus: using right-triangle trigonometry.

green line

How could you as a teacher create an activity or project that involves your topic?
bridge

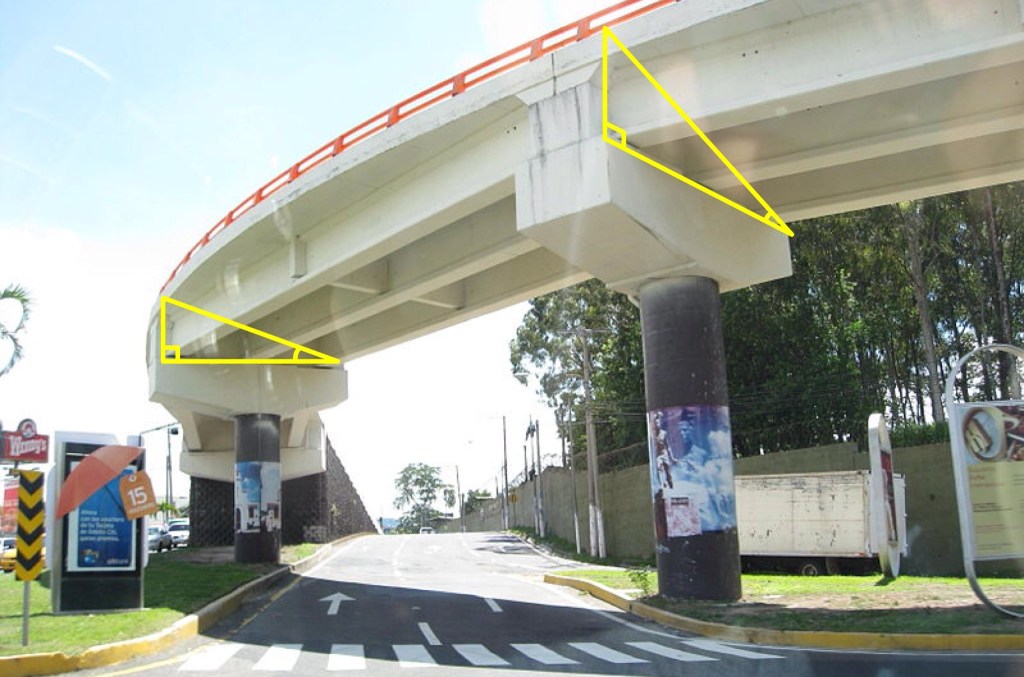
A project that Dorathy Scrudder, Sam Smith, and I did that involves right-triangle trigonometry in our PBI class last week, was to have the students to build bridges. Our driving question was “How can we redesign the bridge connecting I-35 and 635?” The students knew that the hypotenuse would be 34 feet, because there were two lanes, twelve feet each, and a shoulder of ten feet that we provided on a worksheet. As a group, they needed to decide on three to four angles between 10-45 degrees, and calculate the sine and cosine of the angle they chose. One particular group used the angle measures of 10°, 20°, 30°, and 40°. They all calculated the sine of their angles to find the height of the triangle, and used cosine to find the width of their triangle by using 34 as their hypotenuse. The picture above is by Sam Smith, and it illustrates the triangles that we wanted the students to calculate.


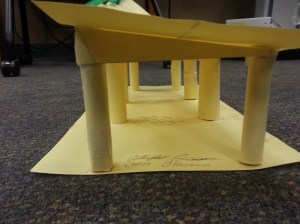
The students were instructed to make a scale model of a bridge so they were told that 1 feet = 0.5 centimeters. Hence, the students had to divide all their calculations by two. Then, the students had to check their measurements of their group members, and were provided materials such as cardstock, scissors, pipe cleaners, tape, rulers, and protractors in order to construct their bridges.  They had to use a ruler to measure out what they found for sine and cosine on the cardstock, and make sure when they connected the line to make the hypotenuse that the hypotenuse had a length of 17 centimeters. After they drew their triangles, they had to use a protractor to verify that the angle they chose is what one of the angles were in the triangle. When our students presented, they were able to communicate what sine and cosine represented, and grasped the concepts.

Below are pictures of the triangles and bridges that one of our groups of students constructed. Overall, the students enjoyed this project, and with some tweaks, I believe this will be an engaging project for right triangle trigonometry.
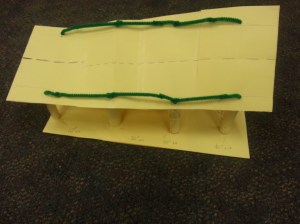
studentbridge3 studentbridge2 studentbridge1

green line

How does this topic extend what your students should have learned in previous courses?


In previous classes, such in geometry, students should have learned about similar and congruent triangles in addition to triangle congruence such as side-side-side and side-angle-side. They should also have learned if they have a right angle triangle, and they are given two sides, they can find the other side by using the Pythagorean Theorem. The students should also have been exposed to special right triangles such as the 45°-45°-90° triangles and 30°-60°-90° triangles and the relationships to the sides. Right triangle trigonometry extends the ideas of these previous classes. Students know that there must be a 45°-45°-90° triangle has side lengths of 1, 1, and \sqrt{2} which the lengths of 1 subtending the 45° angles. They also are aware that a 30°-60°-90° produces side lengths of 1, \sqrt{3} , and 2, with the side length of 1 subtending the 30°, the length of \sqrt{3} subtending the angle of 60°, and the length of 2 subtending the right angle. So, what happens when there is a right angle triangle, but the other two angles are not 45 degrees or 30 and 60 degrees? This is where right triangle trigonometry comes into play. Students will now be able to calculate the sine, cosine, and tangent and its reciprocal functions for those triangles that are right. Later, this topic will be extended to the unit circle and graphing the trigonometric functions as well as their reciprocal functions and inverse functions.


green line

What are the contributions of various cultures to this topic?


Below are brief descriptions of various cultures that personally interested me.


Early Trigonometry


The Babylonians and Egyptians studied the sides of triangles other than angle measure since the concept of angle measure was not yet discovered. The Babylonian astronomers had detailed records on the rising and setting of stars, the motion of planets, and the solar and lunar eclipses.   On the other hand, Egyptians used a primitive form of trigonometry in order to build the pyramids.


Greek Mathematics


Hipparchus of Nicaea, now known as the father of Trigonometry, compiled the first trigonometric table. He was the first one to formulate the corresponding values of arc and chord for a series of angles. Claudius Ptolemy wrote Almagest, which expanded on the ideas of Hipparchus’ ideas of chords in a circle. The Almagest is about astronomy, and astronomy relies heavily on trigonometry.


Indian Mathematics


Influential works called Siddhantas from the 4th-5th centry, first defined sine as the modern relationship between half an angle and half a chord. It also defined cosine, versine (which is 1 – cosine), and inverse sine. Aryabhata, an Indian astronomer and mathematician, expanded on the ideas of Siddhantas in another important work known as Aryabhatiya. Both of these works contain the earliest surviving tables of sine and versine values from 0 to 90 degrees, accurate to 4 decimal places. Interestingly enough, the words jya was for sine and kojya for cosine. It is now known as sine and cosine due to a mistranslation.


Islamic Mathematics


Muhammad ibn Mūsā al-Khwārizmī had produced accurate sine and cosine tables in the 9th century AD. Habash al-Hasib al-Marwazi was the first to produce the table of cotangents in 830 AD. Similarly, Muhammad ibn Jābir al-Harrānī al-Battānī had discovered the reciprocal functions of secant and cosecant. He also produced the first table of cosecants.


Muslim mathematicians were using all six trigonometric functions by the 10th century.  In fact, they developed the method of triangulation which helped out with geography and surveying.


Chinese Mathematics


In China, early forms of trigonometry were not as widely appreciated as it was with the Greeks, Indians, and Muslims. However, Chinese mathematicians needed spherical geometry for calendrical science and astronomical calculations. Guo Shoujing improved the calendar system and Chinese astronomy by using spherical trigonometry in his calculations.


European Mathematics


Regiomontanus treated trigonometry as a distinct mathematical discipline. A student of Copernicus, Georg Joachim Rheticus, was the first one to define all six trigonometric functions in terms of right triangles other than circles in Opus palatinum de triangulis. Valentin Otho finished his work in 1596.


http://en.wikipedia.org/wiki/History_of_trigonometry


Engaging students: Deriving the distance formula

In my capstone class for future secondary math teachers, I ask my students to come up with ideas for engaging their students with different topics in the secondary mathematics curriculum. In other words, the point of the assignment was not to devise a full-blown lesson plan on this topic. Instead, I asked my students to think about three different ways of getting their students interested in the topic in the first place.

I plan to share some of the best of these ideas on this blog (after asking my students’ permission, of course).

This student submission again comes from my former student Shama Surani. Her topic, from Geometry: deriving the distance formula.

green line

A1. What interesting word problems using this topic can your students do now?


By viewing examples on http://www.spacemath.nasa.gov, I came across the following word problem:


A beam of light, traveling at 300,000 km/sec is sent in a round trip between spacecraft located Earth (0,0), Mars (220, 59), Neptune (-3200, -3200), and back to Earth. If the coordinate units are in millions of kilometers, what are:


A)    The total round-trip distance (Earth, Mars, Neptune, Earth) in billions of kilometers?

B) The round trip time in hours?


I believe this problem is an interesting one to ask the students because I believe this question will pique the interests of the students especially if a video clip or visual is presented to grab their attention. This question allows me as a teacher to assess what the students know, and if they can apply the previous concepts learned to this new concept. By the end of the lesson, the students will be able to find out the total distance, and also apply previous concepts with distance = rate * time to figure out how many hours the round trip took.

By the end of the lesson, the students will be able to answer these questions. This problem builds on previous concepts taught so students can tie and see the connections among all topics.

Click to access 377674main_Black_Hole_Math.pdf


green line

A2. How could you as a teacher create an activity or project that involves you topic?

As a teacher, I can create an activity or project that involves the distance formula. I will provide a map of the United States, and have the students plan a trip across the USA covering at least 10 states, and making pit stops along the way of places they would want to visit, such as the Grand Canyon, Las Vegas, etc. The students will have to find the distance of the total trip, as well as the distance between each pit stop. This activity helps the students practice the distance formula while allowing the students to become familiar with the United States and interesting locations to visit in the United States. The students will know be able to see how the calculating distance is related to real life.

http://livelovelaughteach.wordpress.com/category/midpoint-formula/

green line

D1. What interesting things can you say about the people who contributed to the discovery and/or the development of this topic?

Pythagoras, Euclid, and Descartes are the three main mathematicians who are most responsible for the development of the distance formula.  Pythagoras is acknowledged by many scholars as being the one to have invented the distance formula although much record in history has been lost during this period. He was born around 570 B.C. in Samos. As a Greek mathematician and philosopher, he traveled to other parts of the world to learn from other civilizations, and he always was seeking the meaning of life. Pythagoras was amazed with distances as he travelled to Egypt, Babylon, Arabia, Judea, India, and Phoenicia. He is the one credited for one of the first proofs of the Pythagorean theorem, a2 + b2 = c2. The distance formula is derived from the Pythagorean theorem.

Euclid, known as the father of Geometry, also contributed to the distance formula. His third axiom states, “It is possible to construct a circle with any point as its center and with a radius of any length.” If one considers the equation of a circle, x2 + y2 = r2, one will notice that the distance formula is a rearrangement of the equation of a circle formula.

Renee Descartes was the one who developed the coordinate system that allows connection from algebra to geometry. He took the concepts of Euclid and Pythagoras in order to relate the radius to the center point of the circle. Essentially, Descartes came up with the equations used for circles and distance between two points that are used today.


http://harvardcapstone.weebly.com/history2.html


References:


http://www.cs.unm.edu/~joel/NonEuclid/proof.html


http://harvardcapstone.weebly.com/history2.html


http://livelovelaughteach.wordpress.com/category/midpoint-formula/


Engaging students: Classifying polygons

In my capstone class for future secondary math teachers, I ask my students to come up with ideas for engaging their students with different topics in the secondary mathematics curriculum. In other words, the point of the assignment was not to devise a full-blown lesson plan on this topic. Instead, I asked my students to think about three different ways of getting their students interested in the topic in the first place.

I plan to share some of the best of these ideas on this blog (after asking my students’ permission, of course).

This student submission again comes from my former student Samantha Smith. Her topic, from Geometry: classifying polygons.

green line

D. 4. What are the contributions of various cultures to this topic?

Tangrams

The tangram is a puzzle game that originated in China. It has been documented that this puzzle has been played since at least the early 1800s, and even before that. By around 1817, the tangram had gained popularity in Europe and America. Its components consist of seven pieces: one square, one parallelogram, two small isosceles triangles, one medium isosceles triangle, and two large isosceles triangles. Each piece is called a tan. The shapes can be arranged into different figures. As you can see in the picture below, these pieces can be arranged in many ways. For the classroom, the teacher can give the students tans to make their own figures, or the teacher can give them a silhouette of a figure and have the students create the tangram. This is just a fun way to have the students interact with the shapes they are learning about, and experience some world culture.

tangram

http://www.activityvillage.co.uk/tangram-black-and-white

http://www.logicville.com/tangram.htm


green line

B.2. How does this topic extend what your students should have learned in previous courses?

Geo-Boards

When I took Concepts of Algebra and Geometry last semester, we had a full lesson on polygons. The professor gave us a tool called a Geo-Board to model polygons using rubber bands (as pictured below). This was a really fun and short hands-on activity to engage us in the lesson. After we made our shape with the rubber band, we would go more in depth and triangulate it to find the sum of the angles in the polygon. The Geo-Board will be exciting for high school students. The teacher can name a familiar shape that the students can model on their board. Most of the shapes they will be modeling they will have worked with in many previous math courses. Another cool thing about the Geo-Board is that the students can see there is more than one way to make a polygon, as long as they have the right number of sides. Of course there are stricter rules for squares, equilateral triangles, etc.; however, students can still model those shapes on the Geo-Board while the teacher walks around and checks their work.

geoboard2

green line

C. How has this topic appeared in culture?


Traffic Signs


Every day people get into cars and drive. They are expected to follow the laws of the road. One of the first things you learn in Driver’s Ed. are the different traffic signs; their colors, their shapes and what they mean. What I notice is that traffic signs are in the shapes of polygons, and their shape is important to their meaning. A stop sign is an octagon, a yield sign is a triangle, and a pedestrian crossing sign is a pentagon. Knowing these shapes can help determine what a sign means, especially if the driver is too far away to read what it says.

traffic

This is an everyday use of classifying polygons. Students do it all the time; they just might not realize it. Engaging high school students with traffic signs could prove beneficial for them in more ways than one: not just learning about shapes, but about traffic signs they will be tested on before they get their driver’s license, which is what many students are doing in high school.