Yesterday’s post of mathematically wrapping presents was tongue in cheek. This one is elegant and a nice application of principles from geometry.
Source: http://lifehacker.com/the-mathematical-way-to-wrap-presents-of-various-shapes-1748323319
Yesterday’s post of mathematically wrapping presents was tongue in cheek. This one is elegant and a nice application of principles from geometry.
Source: http://lifehacker.com/the-mathematical-way-to-wrap-presents-of-various-shapes-1748323319
In my capstone class for future secondary math teachers, I ask my students to come up with ideas for engaging their students with different topics in the secondary mathematics curriculum. In other words, the point of the assignment was not to devise a full-blown lesson plan on this topic. Instead, I asked my students to think about three different ways of getting their students interested in the topic in the first place.
I plan to share some of the best of these ideas on this blog (after asking my students’ permission, of course).
This student submission comes from my former student Jillian Greene. Her topic, from statistics: standard deviations.

How could you as a teacher create an activity or project that involves your topic?
An activity that I’ve seen presented to introduce the idea of standard deviation requires students to explore the information given to them before actually being taught the math behind standard deviation. As the students settle into their seats, prompt them to work with their shoulder partner and help to measure the width of their left thumbnail (or length of their pointer finger, width of their hand, etc.) and write it on a sticky note. Once the data is collected, the students will calculate the mean of all of the measurements. The mean is then written on the board in the center, and the students are asked to go and stack their post-it notes in either the center if they are perfectly the mean, or on the right or left if it’s bigger or smaller, respectively. Have them find the mean of the distances of each measurement from the mean. When they discover this should be zero, have them discuss with each other and then in the big group what that means. If time provides, it might even be fun to ask deeper understanding questions like what would happen if everyone last half of their thumbnail, or what if just Student A’s thumbnail tripled in size. This will provide a meaningful sequitur into the sometimes confusing world of standard deviation and distances from the mean.
How has this topic appeared in pop culture (movies, TV, current music, video games, etc.)?
http://www.dailymotion.com/video/x3lc0rx
This is a full episode of Everybody Loves Raymond but the clip in reference starts at about 8:45 and lasts a minute or so.
This clip shows a scenario where the couple, Ray and Deborah, is comparing their scores on an IQ test (a very common use for standard deviation). Deborah comments on how her score is very close to Ray’s, being only 15 points higher. The brother that proctored the exam corrected her by saying that 15 points is a standard deviation higher and puts her in a “whole new class” of genius. Have students discuss and explain what it means for Deborah to be one standard deviation higher. Use the information given in the episode (100 is average, 115 is one standard deviation higher) to construct the bell curve for IQ scores. Then use the bell curve to introduce percentiles. Since Ray is the average, center-of-the-bell score, then he is in the 50th percentile. The students can then attempt to discover on their own (or with a group) what percentile Deborah’s score puts her in.
How can this topic be used in your students’ future courses in mathematics or science?
Standard deviation is a topic that pervades almost all sciences. In biology classes, students are asked to student the weather and climate of various habitats. In differentiating between the two, one must look at the overall picture. If the student is presented with the information that place A and place B both have average temperatures of 60 degrees, this information might not be good to take as face value. Place A might have a range from 40 to 80 degrees throughout the year while place B might range from 0 to 100 and then have one or two extremely hot outliers that even the average out to 60. Looking at not only the skew of the bell curve, but also what the standard deviation is for each place, might save a student from forgetting to bring a fan to hypothetical place B, or writing that that the climate of that place is cool year round. In addition to biology, standard deviation is a very necessary operation in psychology, which is a very statistics-based science. This can easily be seen in representing IQ scores how we found earlier!
In my capstone class for future secondary math teachers, I ask my students to come up with ideas for engaging their students with different topics in the secondary mathematics curriculum. In other words, the point of the assignment was not to devise a full-blown lesson plan on this topic. Instead, I asked my students to think about three different ways of getting their students interested in the topic in the first place.
I plan to share some of the best of these ideas on this blog (after asking my students’ permission, of course).
This student submission again comes from my former student Deborah Duddy. Her topic, from Pre-Algebra: introducing proportions.
How can this topic be used in your students’ future courses in mathematics or science?
Proportions, in the form a/b = c/d, is a middle school math topic. The introduction of proportions builds upon the students’ understanding of fractions and ability to solve simple equations. This topic is used in the students’ future Geometry and Statistics courses. The use of proportions is used in Geometry to identify similar polygons which are defined as having congruent corresponding angles and proportional corresponding sides. The use of similar triangles and proportions are used to perform indirect measurements. In Statistics, proportions are used throughout measures of central tendency. Additionally, statistics uses sampling proportions including the proportion of successes.
The ability to use proportions for indirect measurements is also included in the study of Physics, Chemistry and Biology. Chemistry uses proportions to determine based upon the chemical structure of a compound, the number of atoms pertaining to each element of the compound. The study of Anatomy also uses many proportions including leg length/stature or the sitting height ratio (sitting heigh/stature x 100).
How has this topic appeared in high culture (art, classical music, theatre, etc.)?
In art, proportions are expressed in terms of scale and proportion. Scale is the proportion of 2 different size objects and proportion is the relative size of parts within the whole. An example of proportion is Michelangelo’s David. The proportions within the body are based on an ancient Greek mathematical system which is meant to define perfection in the human body. Da Vinci’s Vitruvian Man is also an example of art based upon proportions or constant rates of fractal expansion. The music of Debussy has been studied to show that several piano pieces are built precisely and intricately around proportions and the two ratios of Golden Section and bisection so that the music is organized in various geometrical patterns which contribute substantially to its expansive and dramatic impact.
The use of proportions is also a constant within Greek and Roman classical architecture. Many classical architecture buildings such as the Parthenon illustrate the use of proportions through the building. Additionally, classical architecture uses specific proportions to determine roof height and length plus the placement of columns.
How has this topic appeared in the news?
Proportions are constantly in the news even though they may not be presented in a/b=c/d format. However, the concept of proportion is used throughout news reporting and even advertising. The current news topic is the upcoming Presidential election. Daily, we are provided with new and different poll results. These results are derived via a proportion. For example, 100 people are polled, these results are then derived via proportional concepts to provide a percentage voting for each candidate. Percentage is a specific type of the a/b = c/d proportion. Daily news uses proportions when reporting growth trends for national debt, crime and even new housing starts in DFW. Today, proportions were used when discussing the new Samsung Note7 and its ability to explode. During the winter, proportions are used to tell us how many inches of rain would result from 2 inches of snow. Sports broadcasters also use proportions when discussing the potential of athletes. If the athlete can hit 10 homeruns in 20 games, then he will potentially hit 50 homeruns in 100 games. Proportions even appear in advertising for new medicines detailing the data associated with the medicine trial.
References:
Debussy in Proportion: A Musical Analysis, Dr Roy Howat
Click to access MOEFranklin.pdf
From a friend’s Facebook post (shared with her permission):
For every time a geometry student asks, “When am I ever going to use this in real life?” Well, if your child ever asks you to make her a Harley Quinn costume, and there is no pattern, so you have to draft your own, you will need to find the sides of a square using the measurement of the diagonal…
[I]f you need to have a square patchwork of different colored fabrics which line up on diagonal points for a specific measurement so that you have four colored diagonal squares from the shoulder to just below the waist, you would need to find the measurement of the four equal sides of each square. Then you would add seam allowances so you could cut the squares out of the different colored fabrics and sew them together in exact lines to line up just right so you could make a top that looks like the top the character wears. And since this character is only a cartoon character who has been made into a little doll, not many people out there in the world have yet attempted an actual costume to be worn by a real live girl. Of course, a person could just take a pencil and a ruler and draw squares, but without using math, that person could not put together a patchwork of colored fabric squares with this result.

The finished product:

Strange but true (try it on a calculator):

Richard Feynman learned this from a friend when he was young, and it stuck with him his whole life.
Recently, the American Mathematical Monthly published a visual proof of this identity using a regular 9-gon:

This same argument would work for any 
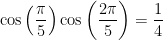
and a regular 17-gon can be used to show that

This post concludes this series about a curious function:
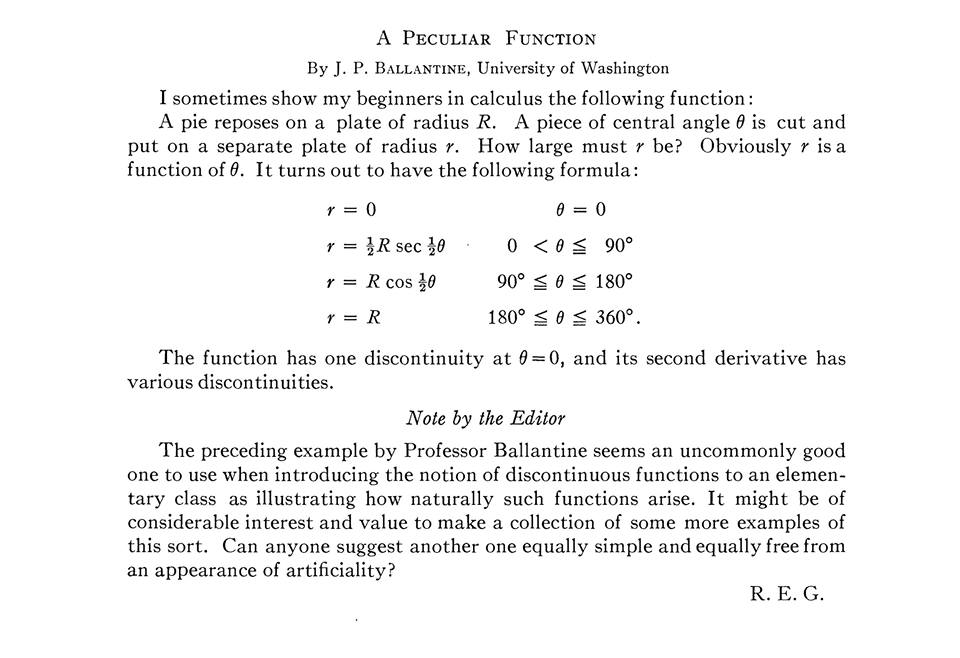 In the previous post, I derived three of the four parts of this function. Today, I’ll consider the last part (
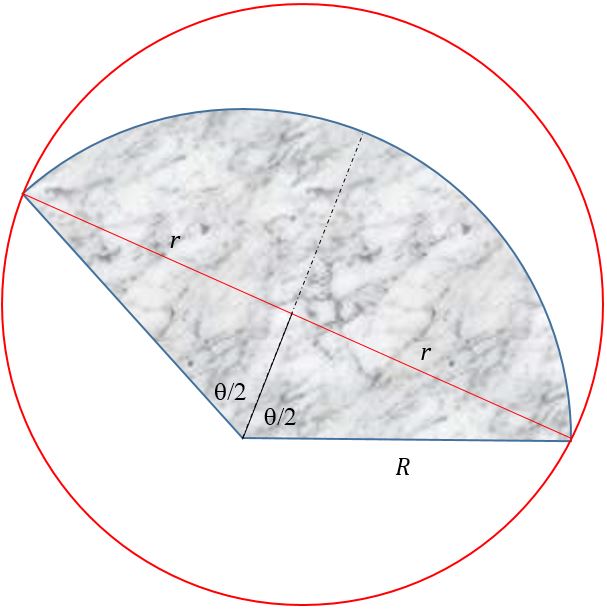 The circle that encloses the grey region must have the points


Furthermore, this line segment will be perpendicular to the angle bisector (the dashed line above), and the center of the enclosing circle must be on the angle bisector. Using trigonometry,

or

We see from this derivation the unfortunate typo in the above Monthly article.
Yesterday, I began a short series motivated by the following article from the American Mathematical Monthly.
Today, I’d like to talk about the how this function was obtained.
If 


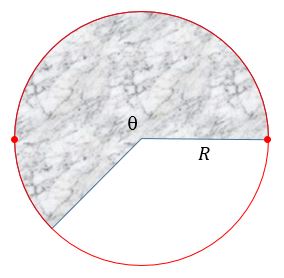
The other extreme is also easy: if 
Let’s now take a look at the case 


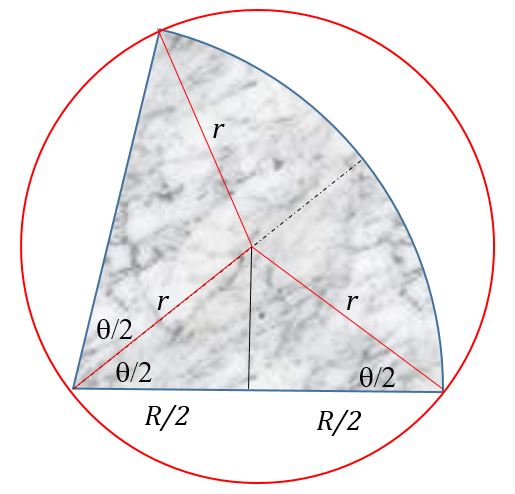
The center must be on the angle bisector (the dashed line depicted in the figure) since the bisector is the locus of points equidistant from

or

This logic works up until