In my capstone class for future secondary math teachers, I ask my students to come up with ideas for engaging their students with different topics in the secondary mathematics curriculum. In other words, the point of the assignment was not to devise a full-blown lesson plan on this topic. Instead, I asked my students to think about three different ways of getting their students interested in the topic in the first place.
I plan to share some of the best of these ideas on this blog (after asking my students’ permission, of course).
This student submission comes from my former student Rory VerNesie. His topic, from Precalculus: graphing rational functions.

So one question may be how this topic can be used in your students future courses in math or science? The students start to learn about this concept in high school, and progressively builds on it until they are expected to know it in college. Courses that require this are: Complex Analysis, Numerical Analysis, Differential Equations, Abstract Algebra, Real Analysis and Meromorphic Functions. These classes deal with understanding what happens as we approach a limit or when the denominator approaches zero. In Abstract Algebra, they talk about a Field of Rational Expressions while Complex Analysis deals with a ratio of polynomials with complex coefficients. In Differential Equations, Rational Functions are seen in slope fields, Separable Equations, and Exact equations. Also in Real Analysis, the talk about convergence using 1/n. Also, Laplace Transforms and partial fractions in electronics and physics may need graphing along with partial fraction decomposition. All in all, graphing Rational Functions is a important part of math because they deal with division over zero or a singularity.
Next, a very important man in the history of rational functions and their graphs was Charles Hermite. This man found a way or algorithm to integrate Rational Functions, while in early 19th century Ostrowski extended this idea and algorithm to Rational Expressions. The neat thing about Hermite is that he helped extend this idea to complex numbers and developed the idea of using interpolation to find the coefficients of rational functions. Without these contributions from Hermite and Ostrowski we would not be able to graph the derivatives of rational functions or the anti derivatives of rational functions. The methods discovered by these men were profound and in some ways led to the discovery of news ideas in math such as partial decomposition and other integration techniques that help integrate Rational Functions. Without these men, Rational Functions and there uses would be known about less.
A great activity involving graphing rational functions would be to have the kids get into groups and assign the each group a certain rational function. Every group would have a team leader who would be in charge of making sure everything about the function gets done. These responsibilities would include, graphing the function, finding the zeros of the function, the asymptotes(Horizontal and Vertical), Removable Discontinuities if any, and the y intercept. The students would then present what they found and would answer any questions for the class. This activity would be a good cooperative learning exercise for students who maybe are not the best at math. This could be a major confidence booster and fun activity for the students. Also they students are learning from each other so they are engaging in discovery learning.
All in all, graphing rational functions is a major part of mathematics and all of these statements mentioned above show how important rational functions are. They deal with division by zero and limits and are a great way to engage students in the novelty of singularities. Graphing polynomials also look really neat when you graph them.
Work Cited
http://integrals.wolfram.com/about/history/
http://www.sciencedirect.com/science/article/pii/0898122176900237
tutorial.math.lamar.edu
Slideplayer.com
 .
.


 .
. . A geometric derivation requires four-dimensional visualization which is beyond of what can be reasonably expected of high school students. Still, students can look at the above two formula and guess that
  is a factor of
  , and that the second factor would contain
  and
and  :
: .
. .
. ,
, ,
,  , etc. become obvious.
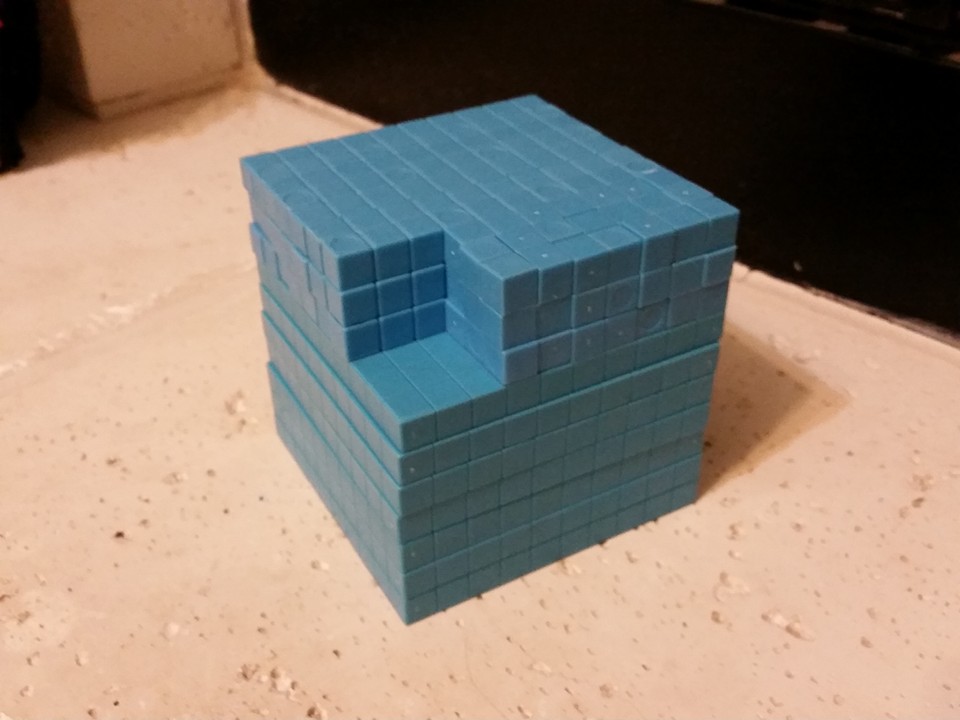
 .
. and
and  , then
 .
. , and the
  came from the fact that the top 3 layers are incomplete.
 .
. ), 10 units long (
 ), and 7 units wide (
 .
. ,
, .
. .
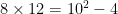
. , and it’s a rare day that I have a student who can actually immediately recall the formula correctly. I suppose that this formula is either never taught in Algebra II or (more likely) students immediately forget the formula after it’s been taught since there’s little opportunity for reinforcing this formula in more advanced courses in mathematics.

 is cut from a corner of a square of side
  . By cutting the remaining figure in two and rearranging the pieces, a rectangle with side lengths of
  and
and  can be formed, thus proving that
 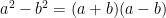 .
.


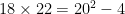
 ,
, without pulling out their calculators.


 ,
,


 .
.


 ,
, .
.