Textbooks have included the occasional awful problem ever since Pebbles Flintstone and Bamm-Bamm Rubble chiseled their homework on slate tablets while attending Bedrock Elementary. But even with the understanding that there have been children have been doing awful homework problems since the dawn of time (and long before the advent of the Common Core), this one is a doozy.

There’s no sense having a debate about standards for elementary mathematics if textbook publishers can’t write reasonable homework problems.
My reaction to this problem is pretty much echoed by the following post: http://www.patheos.com/blogs/friendlyatheist/2015/10/22/sometimes-estimating-is-better-than-getting-the-exact-answer/:
- Yes, this is an awful word problem. This should never have appeared in a math textbook or workbook. But if it appeared in a workbook, then it should never have been assigned by a teacher. And if it accidentally got assigned by a teacher, then the teacher should have extended some grace in the grading of the problem.
- Even with all that said, estimation has been in the elementary curriculum for decades and is not an invention of the Common Core. Furthermore, estimation is an important skill for students to acquire. From the above website:
Suppose you’re buying groceries. You have four items in your cart that cost $1.99, $4.93, $6.03, and $5.14.
If all you have is $20 in your wallet, is that enough to pay for the items?
I think that’s a very realistic question.
It would take you at least a little bit of time to add up those numbers individually and get an exact number. Would it answer your question? Absolutely. But you don’t need an exact answer.
The smarter thing to do would be to simply round the numbers. We should be saying to ourselves, “2 + 5 + 6 + 5 equals 18… throw in some tax… and I should still be under $20.”
Why is that better? Because the exact amount doesn’t really make a difference. You just need to be close enough.
I have deep and profound theological differences with the author of this post. But on this math issue, he’s right on the money (pardon the pun).

 and
and  .
.


 with
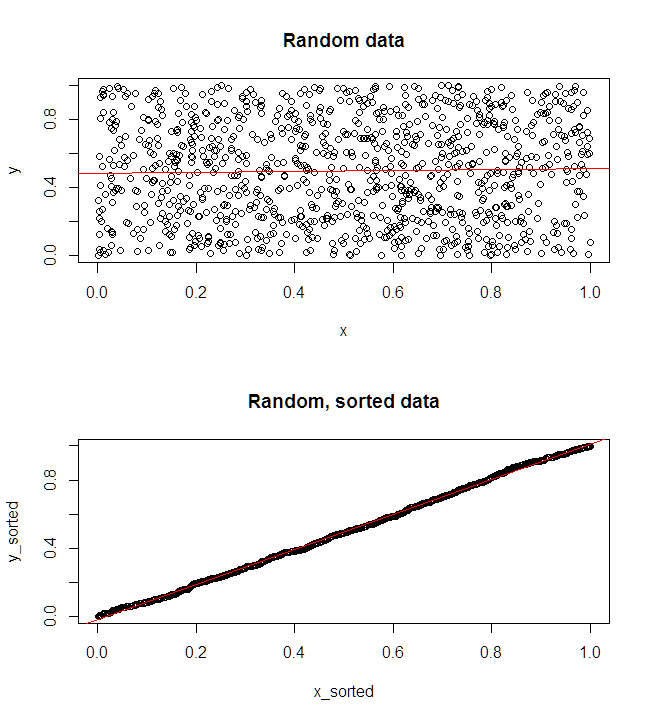
with  points. We want to perform a linear regression, but first we sort the
  values and the
  values independently of each other, forming data set
  . Is there any meaningful interpretation of the regression on the new data set? Does this have a name?