Dancing Statistics: Part 2

From the YouTube description:

A five minute film demonstrating the statistical concept of sampling & standard error through dance.

Project title: ‘Communicating Psychology to the Public through Dance’ (AKA ‘Dancing Statistics’)

Founder & Co-Producer: Lucy Irving
Project Manager & Co-Producer: Elise Phillips
Statistical Lead & Co-Producer: Professor Andy Field
Choreographer: Masha Gurina
Filmmaker: Kyle Stevenson

These films were funded by a BPS Public Engagement with additional funding attracted from IdeasTap.
http://www.bps.org.uk/news/bps-funded…

If you have questions or comments about this film please contact @statsdancer #dancingstatistics or dancingstatistics@gmail.com

The BPS runs an annual public engagement grant scheme. Through these grants we aim to help members promote the relevance of evidence-based psychology to wider audiences either through direct work or by organising interesting and relevant communications activities. For press inquiries please contact the BPS Press Office.

http://www.bps.org.uk/what-we-do/awar…

IdeasTap is an arts charity for young, creative people at the start of their careers.
Visit their website for more information http://www.ideastap.com.


Dancing Statistics: Part 1

From the YouTube description:

A three minute film demonstrating the statistical concept of frequency distributions through dance.

Project title: ‘Communicating Psychology to the Public through Dance’ (AKA ‘Dancing Statistics’)

Founder & Co-Producer: Lucy Irving
Project Manager & Co-Producer: Elise Phillips
Statistical Lead & Co-Producer: Professor Andy Field
Choreographer: Masha Gurina
Filmmaker: Kyle Stevenson

These films were funded by a BPS Public Engagement with additional funding from IdeasTap.
http://www.bps.org.uk/news/bps-funded…

If you have questions or comments about this film please contact @statsdancer #dancingstatistics or dancingstatistics@gmail.com

The BPS runs an annual public engagement grant scheme. Through these grants we aim to help members promote the relevance of evidence-based psychology to wider audiences either through direct work or by organising interesting and relevant communications activities. For press inquiries please contact the BPS Press Office.

http://www.bps.org.uk/what-we-do/awar…

IdeasTap is an arts charity for young, creative people at the start of their careers.
Visit their website for more information http://www.ideastap.com.

Can You Solve This?

A friend forwarded this very interesting video to me. It’s not so much an exercise in mathematics but an exercise in problem-solving and logic and especially confirmation bias. I won’t ruin the video but I’ll give the punch line at the end:

If you think that something is true, you should try as hard as you can to disprove it. Only then can you really get at the truth and not fool yourself.

Engaging students: Finding points on the coordinate plane

In my capstone class for future secondary math teachers, I ask my students to come up with ideas for engaging their students with different topics in the secondary mathematics curriculum. In other words, the point of the assignment was not to devise a full-blown lesson plan on this topic. Instead, I asked my students to think about three different ways of getting their students interested in the topic in the first place.

I plan to share some of the best of these ideas on this blog (after asking my students’ permission, of course).

This student submission again comes from my former student Rebekah Bennett. Her topic, from Pre-Algebra: finding points on the coordinate plane.

green line

Applications: How could you as a teacher create an activity or project that involves your topic?


For this topic, the first thing that came to mind was battleship. The game was introduced to me when I was around 8 or 9 years old. The mathematical content that the game expresses never really occurred to me until I became older and made a connection. The game board for battleship is simply one quadrant of the coordinate plane and the players call out coordinates which are found on the game board. This is the same as finding a point on the coordinate plane but in a much more fun way of doing so.

For those of you who do not know what the game is, here is a quick clip from Seinfeld where they are playing the game.

To make things interesting, we will play Human Battleship. For this activity you would need a large area that can be marked off as a grid, such as a gym or field. Each group will have at least 4 students (ships) that they can place strategically on their side. Since there is no barrier between the sides, the captains must face the opposite direction to ensure they have not seen the opponent’s ships locations. Now each captain will take turns calling out coordinate points and having them recorded by their co-captain. The shipmates must go to each point and yell hit or miss, marking a hit with a red flag and miss with a white flag. When a ship is sunk the shipmates will make a bombing sound so that both captains know they are a down a ship. The students will continue to do this until one team has all their ships sunk and the other is declared the winner.

green line

Curriculum: How can this topic be used in your students’ future courses in mathematics or science?

This topic is used continually throughout mathematics and builds up to something more every day in math. It is a basis for learning how to work with graphs. Students learn how to plot points now and then later they learn how to create graphs according to the points. With graphs, they will learn how to move points along the coordinate plane, learning new vocabulary such as; translation, rotation, reflection, stretch and shrink. Students will then learn how to draw a line using slope to connect one point to another and find the distance between those 2 points. The x and y values work as an input, output function. All these things are based on the simple concept of plotting points which we use in every day math.

This topic is also used throughout the scientific world. The student learns how to make scatter plots and line graphs. Also, science uses functions as well. In science students record data in a table using an x and y value but are typically labeled according to a real life experiment such as growth and amount of water. When conducting research or displaying data the student uses the same techniques for graphs that were learned in math and applies them to science, which builds more and more everyday as well.

green line

History: How was this topic adopted by the mathematical community?

During the European Renaissance, mathematics was split into two separate subjects of geometry and algebra. They didn’t coincide. Algebraic equations were only used in algebra and people only drew pictures in geometry. Rene Descartes changed the whole outcome and combined both subjects together developing a brighter future for mathematics.

Descartes’ method involved two number lines. The student was already introduced to the basic number line in elementary and then introduced to a number line with negative numbers during 8th or 9th grade completing the number line. Knowing that the students have full knowledge of a number line, Descartes decided to put two number lines together. The traditional number line is horizontal and rotated the other number line 90 degrees (vertical) where both of the number lines intersect at zero. These two lines are called axes; such as x-axis (horizontal line) and y-axis (vertical line). Since a number line stretches in both directions, the axes will have arrows on each end. The whole area, side to side, top to bottom, and stretching infinitely in all directions creates a plane. When constructing two axes within a plane, it is then converted to a Cartesian Plane. The name “Cartesian” was derived from the name “Descartes.” From creating a plane, the student can now find a point on the plane using the coordinate pair they are given.

Sources:

http://simple.wikipedia.org/wiki/Cartesian_coordinate_system

http://www.math.wichita.edu/history/men/descartes.html

http://plato.stanford.edu/entries/descartes-mathematics/

Engaging students: Dividing fractions

In my capstone class for future secondary math teachers, I ask my students to come up with ideas for engaging their students with different topics in the secondary mathematics curriculum. In other words, the point of the assignment was not to devise a full-blown lesson plan on this topic. Instead, I asked my students to think about three different ways of getting their students interested in the topic in the first place.

I plan to share some of the best of these ideas on this blog (after asking my students’ permission, of course).

This student submission again comes from my former student Chelsea Hancock. Her topic, from Pre-Algebra: dividing fractions.

green line

Applications (A1)

Students can encounter the division of fractions in a variety of places outside of the classroom. Some of these instances could even happen in your own home! When using fractions, the most common examples include slicing pizza or pie into equal slices. Here is one of those problems:

  1. Assume you have seven-eighths of a whole pizza left. Three of your friends walk into the kitchen and ask for one-fourth of the whole pizza each. If you wanted to share with your friends, will you have enough pizza for each friend to get the amount they want? (Divide 7/8 by 1/4 and see if it’s bigger than three).

 \displaystyle \frac{7/8}{1/4} = \displaystyle \frac{7 \times 4}{8 \times 1} = \displaystyle \frac{28}{8} = 3 \frac{1}{2}

 It is bigger than three, therefore there is, in fact, enough pizza left for all three of your friends to get the amount they wanted.

Other problems might involve finding a fraction of a fraction of a whole. Here is an example of this:

  1. I have a giant cookie jar with 36 cookies in it. My family comes over and eats some of the cookies. If 1/3 of the cookies are eaten and 3/4 of the eaten cookies had frosting, how many of the eaten cookies had frosting? (Multiply 36 by 1/3 to get 12. Then multiply 12 by 3/4).

 \displaystyle 36 \times \frac{1}{3} = \displaystyle \frac{36}{3} =12

 \displaystyle 12 \times \frac{3}{4} = \displaystyle \frac{12 \times 3}{4} = \frac{36}{4} = 9.

Nine of the eaten cookies had frosting.

green lineCurriculum (B2)

In previous mathematics classes, students have obtained a wide variety of skills which can be used when dividing fractions. These skills include the multiplication of whole numbers, the division of whole numbers, and how to reduce fractions to their simplest form. Dividing fractions is an extension of these skills. It can also be said that students already understand what a fraction is. On a separate note, we will discuss how many students relate to fractions and how they think of fractions when confronted with them.

Many students find fractions difficult and intimidating, often freezing when they see a fraction. Involve more than one fraction in a problem and students will get easily frustrated and give up. This can be caused by the way a student perceives fractions. Many students are taught that a fraction is simply part of a bigger whole number. While this is true, many students lose focus on the big picture and get caught up on the fact that a fraction is less than 1 whole unit. In order to help avoid this, teachers could instead try explaining fractions in a slightly different way: a fraction is just a number written like a division problem. The video found at http://www.youtube.com/watch?v=3xwDryouw6o  can help to provide a more in-depth explanation about this new perspective on fractions.

By thinking of a fraction as simply a division problem, students automatically incorporate their previous knowledge on dividing whole numbers. When students work through a problem with dividing fractions, they will go through the steps of “keep, change, and flip.” Once they have changed the division symbol to a multiplication symbol and flipped the second fraction, the students will be ready to use their previous knowledge on multiplying whole numbers. After the numerators and denominators are multiplied respectively and the new fraction is obtained, the students must recall previous knowledge on the reduction of fractions to their simplest form.

green line

Technology (E1)

A video can be used to engage students and give them a foundation for dividing fractions. The video I chose, which can be found at http://www.youtube.com/watch?v=uMz4Hause-o, is an excellent example of an acceptable engagement tool. In the video Flocabulary uses music and repetition to describe how to perform the task of dividing fractions. This will help the students be able to recall the information about dividing fractions later on when they need to. Flocabulary explains the process step-by-step and then demonstrates the method in action, using two different fractions to help students understand how it works. Then the video goes on to explain why we flip the second fraction in a division problem, which is vital for ensuring that actual learning is taking place and not simple memorization. Students need to know why they perform certain steps and why the trick works. While the cartoon animations are meant to target a younger audience, this clip is easy to follow and the repetitious nature of the music puts an interesting spin on learning mathematics.

Engaging students: Determining the largest fraction

In my capstone class for future secondary math teachers, I ask my students to come up with ideas for engaging their students with different topics in the secondary mathematics curriculum. In other words, the point of the assignment was not to devise a full-blown lesson plan on this topic. Instead, I asked my students to think about three different ways of getting their students interested in the topic in the first place.

I plan to share some of the best of these ideas on this blog (after asking my students’ permission, of course).

This student submission again comes from my former student Shama Surani. Her topic, from Pre-Algebra: determining which of two fractions is largest if the denominators are unequal.

green line

A2. How could you as a teacher create an activity or project that involves your topic?

An activity that involves students to determine which of two fractions is greatest is called Compare Fractions, which is a two-player math game found at the website http://www.education.com.  The objective of the game is to work together to determine who has created the largest fraction.  The materials necessary is a deck of cards with the face cards removed, notebook paper, and a pencil.  Below are the directions of this game:

  1. Review the concepts of numerator and denominator.
  2. Decide on a dealer and have him/her shuffle the cards.
  3. Divide the deck evenly among the players.
  4. Have the players place their cards face down in a pile in front of them.
  5. To begin playing, have players turn over two cards from their respective decks and place them in front of themselves.
  6. Players can then decide which card they want to be in the numerator and which card they want to be the denominator.
  7. Now the players have to calculate who has the largest fraction.  There are a variety ways this can be done.  Encourage different methods in determining which fraction is larger.  One way is to multiply the numerator and denominator of each fraction by the denominator of the other fraction. For example, with the fractions 5/6 and 4/7, compute 5/6 x 7/7 = 35/42 and 4/7 x 6/6 =24/42.  The largest fraction is 35/42 so 5/6 must be greater than 4/7.
  8. The player who has the largest fraction wins all of the cards played in the round.  For the instance of a tie (when the both students have equivalent fractions), split the cards evenly among the players.
  9. The game is over when the players have accumulated all of the cards.
  10. Have the players count their cards.  Whoever has the most cards, wins.

I believe this activity will be fun for the students because they are creating their own fractions with the cards.  Once the students are comfortable with determining which of the two fractions is greatest, the teacher can start timing the students if he/she wants to.

green line

B2.  How does this topic extend what your students should have learned in previous courses?

In previous courses, students should have learned how to draw a number line and determine where on the number line two natural numbers are located.  They would have known how to compare numbers or order the numbers from least to greatest or greatest to least.  Then, the students were exposed to fractions as being a part of whole, and being called rational numbers. This concept is then extended to ordering fractions with equal denominators with visual diagrams and using the number line.  In a visual illustration, the students can be exposed to two circles of the same size but divided into the same amount of sections.  For example, both circles can be divided into four equal sections, but one can have two sections filled in while the other has three sections filled in.  Students then can determine which circle is larger.  In this case, the circle with three sections filled in is larger.  Then this concept is extended to be written in fraction format where the first circle is 2/4 and the other circle is 3/4. When the students have fractions with equal denominators, they look at the numerator to see which fraction is larger or smaller.  Determining which of two fractions is greatest if the denominators are not equal extends off this previous concept.  The best way is to show the students visually how different shapes such as a square or a circle can be divided equally into different sections. For example, the first circle might be divided into four sections with three sections shaded while the other circle can be divided into eight sections with seven shaded. In fraction form, the first circle is 3/4 while the other circle is 7/8.  Here the students will notice that the denominators are different but by looking at the shaded circles, they can see that 7/8 is larger than 3/4.

green lineE1.  How can technology be used to effectively engage students in this topic?

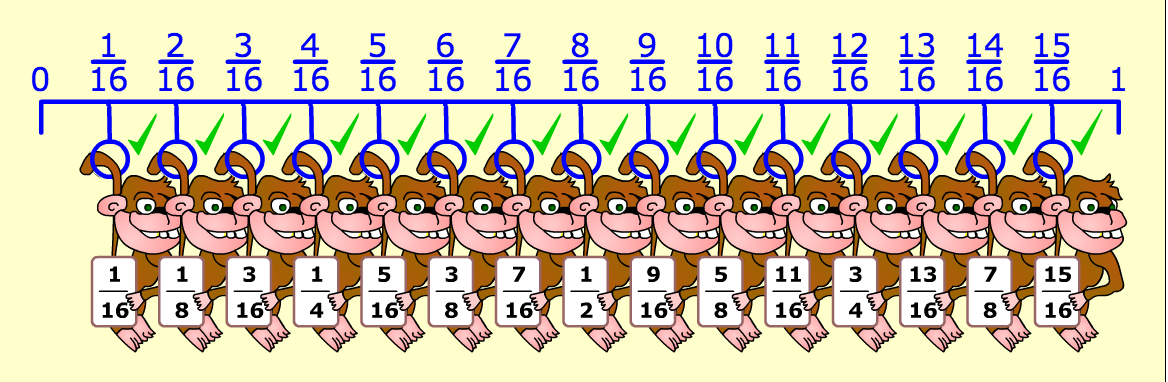
Technology is increasing day by day, and in many respects, technology can be the tool for aiding learning in the classrooms.   One way that technology can be used to effectively engage students in determining which of two fractions is greatest when the denominators are unequal by playing simple online games.  Since several schools are distributing i-Pads to their students, I have found an i-Pad application called “Fraction Monkeys” that the students can download for free for this lesson.  This application is a wonderful tool in demonstrating how fractions with same or different denominators are located on the number line.  The objective of this game is that a monkey with a fraction will appear on the screen.  The student will have to place the monkey correctly on the number line.  Sometimes the card the monkey holds up is in reduced form, so the student will have to think about how that reduced form relates to the number line.

For example, below is a picture of a number line with the denominator being 16.   When the student is finished placing the monkeys on the correct location, they will notice that the monkeys were placed differently depending on what fraction they received.

MonkeyFraction1

By providing the students with a guided worksheet, the students will be able to compare which fractions are greater and which fractions is less than the other by viewing the number line.  For example:

\displaystyle \frac{7}{8} ~~ ? ~~ \frac{3}{4}

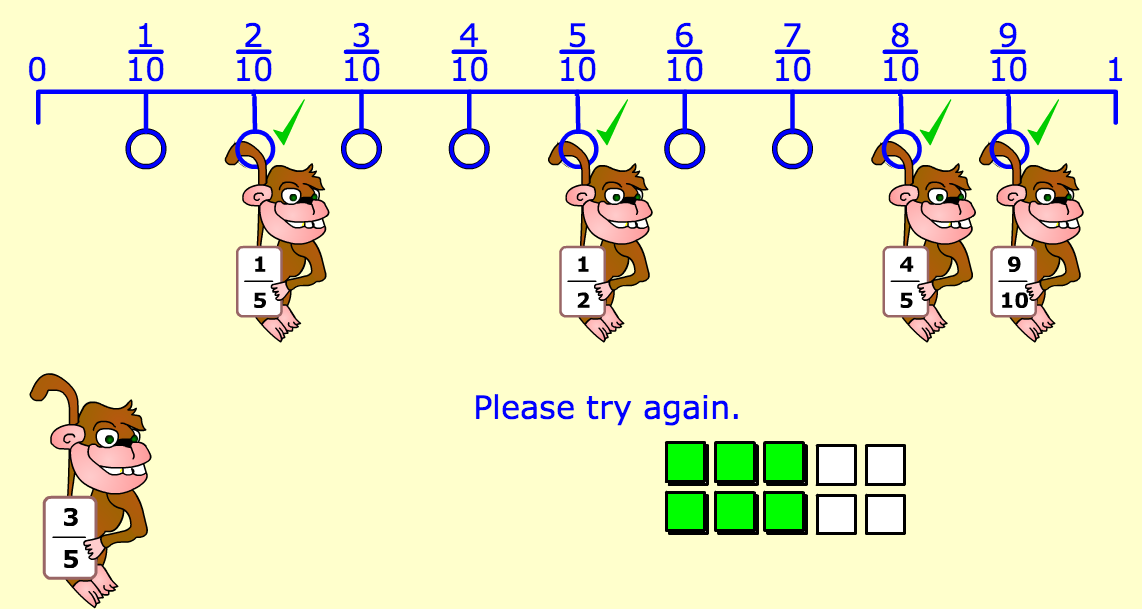
            The student will answer that 7/8 is greater than 3/4 since 3/4 comes before 7/8 on the number line.  I believe this activity will help the students conceptualize how to compare fractions.  In addition, in case when the student incorrectly places a monkey on the number line, a hint with little squares pops up where the student can visually see how their fraction relates to the number line.  Below is a picture demonstrating this: MonkeyFraction2

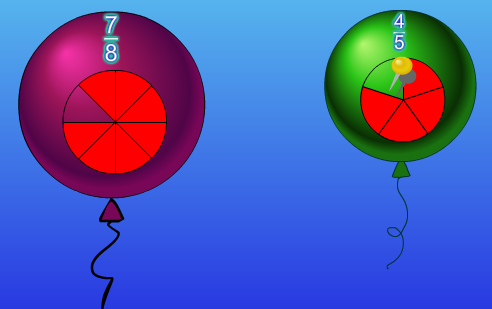
Another computer game that involves comparing fractions is named “Balloon Pop Math.”  This is also a good resource to use because it shows balloons with fractions with a visual of a circle divided in equal sections.  The idea of this game is to pop the balloon with the smallest fraction to the largest fraction with different denominators.   Below is a picture from the game demonstrating the fractions 7/8 and 4/5.  The students will be able to see that 4/5 is less than 7/8 by looking at the circle so the student will pop the balloon that contains 4/5.  This game is also wonderful to use because it contains three levels.  The first level allows the students to compare two fractions.  The next one allows the student to compare three fractions, and the last level allows the students to compare four fractions.  This will be a good engagement activity to allow the students to do before teaching about how to compare which two fractions is greater than the other.BalloonFraction

References:

http://www.fractionmonkeys.co.uk/activity/

http://www.sheppardsoftware.com/mathgames/fractions/Balloons_fractions1.htm

http://www.education.com/activity/article/capture-that-fraction/

Engaging students: Expressing a rate of change as a percentage

In my capstone class for future secondary math teachers, I ask my students to come up with ideas for engaging their students with different topics in the secondary mathematics curriculum. In other words, the point of the assignment was not to devise a full-blown lesson plan on this topic. Instead, I asked my students to think about three different ways of getting their students interested in the topic in the first place.

I plan to share some of the best of these ideas on this blog (after asking my students’ permission, of course).

This student submission again comes from my former student Samantha Smith. Her topic, from Pre-Algebra: expressing a rate of change as a percentage.

green line

A1. What interesting (i.e., uncontrived) word problems using this topic can your students do now?

The TLC show Extreme Cheapskates follows the lives of Americans who are very frugal with their money. In this clip, a man takes his wife to the movies and does everything he can to save money. Expressing a rate of change as a percentage is most commonly associated with spending money, such as a sign in a store saying “50% off all merchandise.” Using this clip as an introduction, I can have my students practice calculating how much money they are saving on buying certain items. I can bring in a catalog and coupons and have my students “buy” 3 items and calculate how much they saved. This is a real world application that students will use for the rest of their lives. Looking back on the video, students may notice that the man had a rate of change of 100%. Instead of paying full price for the drink and popcorn, he saved 100% of his money (or paid 0%). Even though his wallet was happy, I’m sure his wife wasn’t after seeing this on TV.

green line

C1. How has this topic appeared in pop culture (movies, TV, current music, video games, etc.)?

Facebook is the largest social networking site on the internet. There are many high school students that constantly check their Facebook and most of them post to get attention from their followers. The article link below gives 7 pieces of advice on how to get more attention on Facebook. For example, number 1 says “Photo posts get 39% more interaction.” As I am introducing the topic of changing rates as a percentage, I can have my students try to analyze what these numbers really mean. The important thing to stress about this article is not the just the numbers themselves, but the verbs attached to the percentages such as “increasing.” This shows the rate is changing. Combining this topic and a website the students use every day is sure to grab their attention.

http://blog.bufferapp.com/7-facebook-stats-you-should-know-for-a-more-engaging-page

green line

C3. How has this topic appeared in the news?

I know, for myself, that I love eating fast food, and I’m sure I am not the only one. However, after New Year’s Resolutions are made, many people choose to give up the glorious taste and convenience of fast food for options that are healthier. This trend causes many fast food chains, such as McDonalds, to lose customers. As mentioned in the article below, McDonald’s guest counts have fallen 16% in the U.S. in 2013. This causes the company to make changes to attract more customers. Rates of change expressed as percentages are very common in the analysis of businesses. Students will perk up when they hear this topic because it is interesting to see how their personal diet choices effect major restaurants.

http://abcnews.go.com/Business/wireStory/mcdonalds-profit-fewer-customers-21634926