Engaging students: Solving for unknown parts of triangles and rectangles

In my capstone class for future secondary math teachers, I ask my students to come up with ideas for engaging their students with different topics in the secondary mathematics curriculum. In other words, the point of the assignment was not to devise a full-blown lesson plan on this topic. Instead, I asked my students to think about three different ways of getting their students interested in the topic in the first place.

I plan to share some of the best of these ideas on this blog (after asking my students’ permission, of course).

This student submission comes from my former student Michelle McKay. Her topic, from Algebra I: solving for unknown parts of triangles and rectangles.

green line

A. How could you as a teacher create an activity or project that involves your topic?

There are several different ideas that immediately come to mind on how to center a lesson around solving for unknown parts of rectangles and triangles. I would like to focus on and describe one. For this particular lesson, the student will start by making a prediction of which side(s) of a shape (triangle or rectangle) has the greatest length. Then, with a partner, they will use rulers and a handout to record the dimensions of both shapes. On the handout, they will work to fill out the chart provided. Then, we will reconvene as a class and talk about the discoveries made. For rectangles, I would ask first about what we found to be consistent for every rectangle. Using what we know, how we could find or solve for the length of one side if we only had certain parts of information? Similarly for triangles, I would begin by asking how each side differed from one another. Did the general shapes of the triangles make a difference? What was special about the right triangles? After these questions, I would introduce Pythagorean’s Theorem and have them solve for the side of triangles without rulers, then follow up with using rulers to verify their information.

green line

D. What interesting things can you say about the people who contributed to the discovery and/or the development of this idea?

Pythagoras of Samos: During Pythagoras’ time, math was considered to be a mixture of both religious and scientific beliefs and was often associated with secret societies and only those of very high social standing. As Pythagoras was one of the more influential mathematicians of his time, most details of his life were kept secret until centuries after his death, leaving very little reliable information to be pieced together in form of a biography. It is generally accepted that he was born on the island of Samos, which is now incorporated into the country of Greece. Little is known about his childhood, but most agree that he was very well educated and was acquainted with geometry before he traveled to Egypt. He was known to be almost sacrosanct and divine to those alive during his time and even a few well after his death. He founded a religious, and simultaneously mathematical, movement called Pythagoreanism, which consisted of two schools of thought: the “learners” and the “listeners”.

green line

D. What are the contributions of various cultures to this topic?

Time Period

Civilization

Contribution

Earliest known references:

23rd Century B.C.

Babylonians

–          Had rules for generating Pythagorean triples.

–          Comprehended the relationship of a right triangle’s sides.

–          Discovered the relationship of \sqrt{2}.


500 – 200 B.C.

Chinese

–          Gives a statement and geometrical demonstration of the Pythagorean Theorem (possibly before Pythagoras’ time).


570 – 495 B.C.

Greek

–          Golden rectangles were very vaguely referenced by Plato.

–          Euclid wrote a clear definition of what a rectangle is.

–          Pythagoras discovered a relationship between the sides of right triangles.


Earliest known references:
800 – 600 B.C.

Indian

–          Pythagorean Theorem was utilized in forming the proper dimensions for religious altars.

It is very hard to for historians to pinpoint with exact certainty which civilization was the first to discover what we know now as the Pythagorean Theorem. Many of the civilizations listed above existed during the same time period, but were geographically located on opposite ends of the map. Also due to loss of information from translations, damaged or completely destroyed texts, these dates and the authenticity of certain contributions are still debated to this day.

 Sources

  1. http://www-history.mcs.st-and.ac.uk/Biographies/Pythagoras.html
  2. http://ualr.edu/lasmoller/pythag.html
  3. http://www-history.mcs.st-and.ac.uk/Biographies/Euclid.html
  4. http://plato.stanford.edu/entries/pythagoreanism/

Engaging students: Venn diagrams

In my capstone class for future secondary math teachers, I ask my students to come up with ideas for engaging their students with different topics in the secondary mathematics curriculum. In other words, the point of the assignment was not to devise a full-blown lesson plan on this topic. Instead, I asked my students to think about three different ways of getting their students interested in the topic in the first place.

I plan to share some of the best of these ideas on this blog (after asking my students’ permission, of course).

This student submission comes from my former student Michelle McKay. Her topic, from Probability: Venn diagrams.

green line

A. What interesting word problems using this topic can your students do now?

In my opinion, you can create a word problem with Venn diagrams on just about anything. To make a word problem more interesting, you can relate the problem to an upcoming event or holiday, make a cultural reference, or even discuss students’ hobbies (i.e. video games, books, etc.).

On Valentine’s Day, a survey of what gifts a women received from their significant other yielded surprising results.

76% of the women surveyed received a card.

72% received chocolate.

49% received flowers.

21% received chocolate and a card.

5% received a card and flowers.

7% received chocolate and flowers.

33% received chocolate, a card, and flowers.

If a woman from the survey was selected at random, what would the probability of her having not received a Valentine’s Day gift be? What is the probability that she received any combination of two gifts? What is the probability that she received a card and flowers, but not chocolate?

green line

B.     How can this topic be used in your students’ future courses in mathematics or science?

Venn diagrams are an excellent way to organize information. They can organize and be a visual representation of gathered statistics (like in the above section). They can also organize general ideas and concepts, distinguishing them as unique or shared amongst other ideas/concepts. A student can use Venn diagrams in either of these manners for both math and science classes of any difficulty.


green line

B. How does this topic extend what your students should have learned in previous courses?

When using Venn diagrams to represent statistics, it reinforces the idea that parts cannot be larger than the whole. We know when using Venn diagrams for statistical data that the decimals must add up to 1 to represent 100%. Students should realize that adding the decimals and getting a number that is larger than or smaller than 1 means they miscalculated or there is “missing” data. By “missing” data, I mean to say that they did not enter in all the given information correctly.


Engaging students: Deriving the distance formula

In my capstone class for future secondary math teachers, I ask my students to come up with ideas for engaging their students with different topics in the secondary mathematics curriculum. In other words, the point of the assignment was not to devise a full-blown lesson plan on this topic. Instead, I asked my students to think about three different ways of getting their students interested in the topic in the first place.

I plan to share some of the best of these ideas on this blog (after asking my students’ permission, of course).

This student submission comes from my former student Michelle McKay. Her topic, from Algebra II: deriving the distance formula.

green line

C. How has this topic appeared in pop culture?

Numb3rs is a relatively popular TV show that revolves around the character Dr. Charlie Eppes, a mathematician. The show’s plot is primarily centralized around Dr. Eppes’ ability to help the FBI solve various crimes by applying mathematics.

Numb3rs

In the pilot episode, Dr. Eppes uses Rossmo’s Formula to help narrow down the current residence of a criminal to a neighborhood. Rossmo’s Formula is a very interesting in that it predicts the probability that a criminal might live in various areas. In the Numb3rs episode, Charlie manipulates the formula and projects the results onto a map to show the hot spot, or rather, the location where the criminal is most likely to be living in.

Rossmo’s Formula, however, would not be complete without including what we know as a Manhattan distance formula, which is just a derivation of the Euclidian distance formula.

green line

From the distance formula we can derive…

The distance formula is a byproduct of Pythagorean’s Theorem. By examining any two points on a two dimensional plane, x and y components could be observed and used to calculate the distance between the points by forming a right triangle and solving for the hypotenuse. Later in time, the distance formula has been adapted to fit many different situations. To name a few, there is distance in Euclidean space and its variations (Euclidean distance, Manhattan or taxicab distance, Chebyshev distance, etc.), distance between objects in more than two dimensions, and distances between a point and a set.

green line

E. Technology

The best way for students to really understand the distance formula is to allow them to make it their discovery. We can handle this in many ways. One of the more obvious explorations is to give them a piece of graph paper and have them plot points. However, this is an instance where technology can serve a great purpose in the classroom.  There are vast amounts of apps online that will allow students to manipulate two points on a grid. After looking at several different apps, I find the one I have listed in the sources to be great for a few reasons. First, students can move two points around a virtual grid. This is a “green” activity and saves paper. Second, while students move the points, a right triangle is automatically drawn for them. Depending on the level of the class, students can make connections between the Pythagorean Theorem and how it leads to the distance formula. Third, above the grid is an interactive equation. It automatically plugs in the values of the points on the grid and finds the distance between them. What is even more impressive is that it solves the equation in steps.

Engaging students: Geometric sequences

In my capstone class for future secondary math teachers, I ask my students to come up with ideas for engaging their students with different topics in the secondary mathematics curriculum. In other words, the point of the assignment was not to devise a full-blown lesson plan on this topic. Instead, I asked my students to think about three different ways of getting their students interested in the topic in the first place.

I plan to share some of the best of these ideas on this blog (after asking my students’ permission, of course).

This student submission comes from my former student Michelle McKay. Her topic, from Precalculus: geometric sequences.

green line

A.     What interesting word problems using this topic can your student do now?

In the movie Pay it Forward (2000), the young boy Trevor has the following idea: He can make the world a better place by encouraging people to help others.

payitforward

If Trevor helps three people and asks that they help three other people instead of repaying him, how can we represent this as a sequence? Write the first 5 terms.  (Hint: Let Trevor be represented by the number 1.)

What is a formula that can give us the amount of people affected after n terms?

When will 177,147 people be affected? 14,348,907 people?

green lineB.     How can this topic be used in your students’ future courses in mathematics or science?

For science classes, geometric sequences can be used to represent data collected for exponential growth or decay of a population or solution over time. Below are some examples of how geometric sequences can appear in a future science class.

Biology: A researcher is determining whether a certain species of mouse is thriving in its environment or becoming endangered. The total population of the mouse is calculated each year. What conclusions can you draw from the data below?

Year

Population

1

240

2

720

3

2,160

4

6,480

5

19,440

Chemistry: A student has been monitoring the amount of Na in a solution. Based off the data collected, when will the Na in the solution be negligible?

Day

Na %

1 95%
2 42.75%
3 19.24%
4 8.65%

Physics: Students in a physics class measure the following heights of a ball that has been dropped from 10 feet in the air. Each measured height is taken at the highest point in the ball’s trajectory.

10

8

6.4

5.12

4.096

Source: http://www.phschool.com/atschool/academy123/english/academy123_content/wl-book-demo/ph-256s.html

green lineA.     Application of geometric sequences.

The following prompt can be used as a short response or in-class debate:

A student is standing a distance of x meters away from the front of the classroom. If he decreases the distance between himself and the front of the classroom by half each time he moves, will he ever reach the front of the classroom? What if instead of a student, we use a point on a line? Justify your answer.


Engaging students: right-triangle trigonometry

In my capstone class for future secondary math teachers, I ask my students to come up with ideas for engaging their students with different topics in the secondary mathematics curriculum. In other words, the point of the assignment was not to devise a full-blown lesson plan on this topic. Instead, I asked my students to think about three different ways of getting their students interested in the topic in the first place.

I plan to share some of the best of these ideas on this blog (after asking my students’ permission, of course).

This student submission comes from my former student Kelsie Teague. Her topic, from Precalculus: right-triangle trigonometry.

green line

How has this topic appeared in popular culture?

In the famous T.V. show Numbers they do an episode using trig to find the angle of origin of the blood spatter. In forensic science they use trig every day to determine where the victim was originally injured. They can also use this to find the angle of impact, area/point of convergence, and area of origin.  The following power point goes into more detail: http://cmb.physics.wisc.edu/people/gault/Blood%20Splatter%20Trig.pdf

 If the blood was dropped by a 90-degree angle, the stain will appear to be an almost perfect circle.

We could get out some long paper and colored water and experiment with the idea of change of angle in the drop of blood and calculate the angles.

Angle of Impact =Sin (theta)= Width of drop/Length of drop.

green line

How can technology (YouTube, Khan Academy [khanacademy.org], Vi Hart, Geometers Sketchpad, graphing calculators, etc.) be used to effectively engage students with this topic?

YouTube is a great website for engagement because you can find many videos to start the lesson off with some previous knowledge that they will be using for that days lesson. The following video would be a good way to engage the students when talking about right triangle trig.

It’s to a song that they probably have already heard and it’s teaching them something they already know. Since the students already have knowledge of this, the video isn’t teaching them the topic but refreshing their memory in a entertaining fashion.

When looking for a good video, I ran across many that would work for this lesson, but this one seemed like it would grab the student’s attention more and keep their attention.

The above video is also a good one, and it shows the lyrics in the description so you can make sure what they are saying is mathematically correct so it doesn’t give the students any misconceptions.

green line

How could you as a teacher create an activity or project that involves your topic?

If I was teaching at a school that was close to a hill or a mountain outside I could take my students outside and have them figure out how far up the mountain they would have to walk to get to the top. We could use a tap measure to measure how high they had the protractor in the air and then we could look up the height and distance away of the mountain. They then could use the protractor to find the angle between themselves and the top of the mountain. We could then use this information inside the classroom to solve how far to travel up the mountain.

mountaintrigSimilar to the above picture except they will know the height of the mountain.  This would show the length of the hypotenuse of the right triangle. They will have to subtract the height they have the protractor at from the height of the mountain to be accurate since the height of the mountain is from the ground up.

Mathematics and College Football

For years, various algorithms (derisively called “the computers” by sports commentators) have been used to rank college football teams. The source of derision is usually quite simple to explain: most of these algorithms are too hard to explain in layman’s terms, and therefore they are mocked.

For both its simplicity and its ability to provide reasonable rankings, my favorite algorithm is “Random Walker Rankings,” published at http://rwrankings.blogspot.com. Here is a concise description of this ranking system (quoted from http://rwrankings.blogspot.com/2003_12_01_archive.html):

We’ve all experienced befuddlement upon perusing the NCAA Division I-A college football
Bowl Championship Series (BCS) standings, because of the seemingly divine inspiration that must have been incorporated into their determination. The relatively small numbers of games between a large number of teams makes any ranking immediately suspect because of the dearth of head-to-head information. Perhaps you’ve even wondered if a bunch of monkeys could have ranked the football teams as well as the expert coaches and sportswriters polls and the complicated statistical ranking algorithms.

We had these thoughts, so we set out to test this hypothesis, although with simulated monkeys (random walkers) rather than real ones.

Each of our simulated “monkeys” gets a single vote to cast for the “best” team in the nation, making their decisions based on only one simple guideline: They periodically look up the win-loss outcome of a single game played by their favorite team, and flip a weighted coin to determine whether to change their allegiance to the other team. In order to make this process even modestly reasonable, this random decision is made so that there is higher probability that the monkey’s allegiance and vote will go with the team that won the head-to-head contest. For instance, the weighting of the coin might be chosen so that 75% (say) of the time the monkey changes his vote to go with the winner of the game, meaning only a 25% chance of voting for the loser.

The monkey starts by voting for a randomly chosen team. Each monkey then meanders around a network which describes the collection of teams, randomly changing allegiance from one team to another along connections representing games played between the two teams that year. This network is graphically depicted in the figure here, with the monkeys—okay, technically one is a gorilla—not so happily lent to us by Ben Mucha (inset). It’s a simple process: if the outcome of the weighted coin flip indicates that he should be casting his vote for the opposing team, the monkey stops cheerleading for the old team and moves to the site in the network representing his new favorite team. While we let the monkeys change their minds over and over again—indeed, a single monkey voter will forever be changing his vote in this scheme—the percentage of votes cast for each football team quickly stabilizes. We thereby obtain rankings each week of the season and at the end of the season, based on the games played to that point of the season, by looking at the fraction of monkeys that vote for each team…

The virtue of this ranking system lies in its relative ease of explanation. Its performance is arguably on par with the expert polls and (typically more complicated) computer algorithms employed by the BCS. Can a bunch of monkeys rank football teams as well as the systems in use now? Perhaps they can.

Using this algorithm, here’s the current ranking of college football teams as of today. (With great pride, I note that Stanford is ranked #4.) These rankings certainly don’t exactly match the latest AP poll or BCS rankings, but they’re also still reasonable and defensible.

RWFL2011

Area of a circle (Part 4)

Math majors are completely comfortable with the formula A = \pi r^2 for the area of a circle. However, they often tell me that they don’t remember a proof or justification for why this formula is true. And they certainly don’t remember a justification that would be appropriate for showing geometry students.

In this series of posts, I’ll discuss several ways that the area of a circle can be found using calculus. I’ll also discuss a straightforward classroom activity by which students can discover for themselves why A = \pi r^2.green line

In the previous three posts, I discussed various ways that calculus can be used to show that A = \pi r^2. Still, most future high school teachers would like to know a justification for why A = \pi r^2. After all, the definition of \pi is

\pi = \displaystyle \frac{ \hbox{Circumference} }{ \hbox{ Diameter}}, or C = 2\pi r

So there ought to be a reasonable explanation for why \pi reappears in the formula for the area of a circle. Furthermore, this explanation should within the grasp of geometry students — so that the explanation should not explicitly use calculus. Even better, they’d prefer a hands-on classroom activity so that students could discover the formula for themselves.

The video below shows a completely geometric justification for why A = \pi r^2 that meets the above criteria. I have a couple of small quibbles with the narrated text — I’d prefer to say that the each rearrangement of pieces is approximately a parallelogram (as opposed to a rectangle), and that figures get closer and closer to a real parallelogram with area A = \pi r^2.

In other words, I would avoid saying that we ultimately divide the circle into infinitely many wedges of infinitesimal width to get a perfect rectangle, as this promotes a misconception concerning the definition of a limit that they shouldn’t carry into a future calculus course.

However, the graphics are excellent in this video. In my mind, that more than counterbalances the preferred way that I would describe the process of taking a limit to students.

Pedagogically, I would recommend a hands-on activity along these lines. Let the students use a protractor to draw a 5- or 6-inch circle on a piece of paper. Then have them mark 18 points on the circumference of the circle at every 20^o, and then draw the lines connecting these points and the center of the circle. Then have the students cut out these wedges and physically rearrange them as in the video. They should discover for themselves that the wedges approximately form a parallelogram, and they know how to find the area of a parallelogram.

After they do this activity, then I would show the above video to geometry students.

If anyone knows a video that (1) is as visually appealing as the one above and (2) correctly states the principle of limit for geometry students, please let me know.

Area of a circle (Part 3)

Math majors are completely comfortable with the formula A = \pi r^2 for the area of a circle. However, they often tell me that they don’t remember a proof or justification for why this formula is true. And they certainly don’t remember a justification that would be appropriate for showing geometry students.

In this series of posts, I’ll discuss several ways that the area of a circle can be found using calculus. I’ll also discuss a straightforward classroom activity by which students can discover for themselves why A = \pi r^2.green lineIf R denotes a circular region with radius a centered at the origin, then

A = \displaystyle \iint_R 1 \, dx \, dy

This double integral may be computed by converting to polar coordinates. The distance from the origin varies from r=0 to r=a, while the angle varies from \theta = 0 to \theta = 2\pi. Using the conversion dx \, dy = r \, dr \, d\theta, we see that

A = \displaystyle \int_0^{2 \pi} \int_0^a r \, dr \, d \theta

A = \displaystyle \int_0^{2\pi} \left[ \frac{r^2}{2} \right]_0^a \, d\theta

A = \displaystyle \int_0^{2\pi} \frac{a^2}{2} \, d\theta

A = \displaystyle 2 \pi \cdot \frac{a^2}{2}

A = \displaystyle \pi a^2

We note that the above proof uses the fact that calculus with trigonometric functions must be done with radians and not degrees. In other words, we had to change the range of integration to [0,2\pi] and not [0^o, 360^o].

Area of a circle (Part 2)

Math majors are completely comfortable with the formula A = \pi r^2 for the area of a circle. However, they often tell me that they don’t remember a proof or justification for why this formula is true. And they certainly don’t remember a justification that would be appropriate for showing geometry students.

In this series of posts, I’ll discuss several ways that the area of a circle can be found using calculus. I’ll also discuss a straightforward classroom activity by which students can discover for themselves why A = \pi r^2.green line

A circle centered at the origin with radius r may be viewed as the region between f(x) = -\sqrt{r^2 - x^2} and g(x) = \sqrt{r^2 - x^2}. These two functions intersect at x = r and x = -r. Therefore, the area of the circle is the integral of the difference of the two functions:

A = \displaystyle \int_{-r}^r \left[g(x) - f(x) \right] \, dx= \displaystyle \int_{-r}^r 2 \sqrt{r^2 - x^2} \, dx

This may be evaluated by using the trigonometric substitution x = r \sin \theta and changing the range of integration to \theta = -\pi/2 to \theta = \pi/2. Since dx = r \cos \theta \, d\theta, we find

A = \displaystyle \int_{-\pi/2}^{\pi/2} 2 \sqrt{r^2 - r^2 \sin^2 \theta} \, r \cos \theta d\theta

A = \displaystyle \int_{-\pi/2}^{\pi/2} 2 r^2 \cos^2 \theta d\theta

A = \displaystyle r^2 \int_{-\pi/2}^{\pi/2} (1 + \cos 2\theta) d\theta

A = \displaystyle r^2 \left[ \theta + \frac{1}{2} \sin 2\theta \right]_{-\pi/2}^{\pi/2}

A = \displaystyle r^2 \left[ \left( \displaystyle \frac{\pi}{2} + \frac{1}{2} \sin \pi \right) - \left( - \frac{\pi}{2} + \frac{1}{2} \sin (-\pi) \right) \right]

A = \pi r^2

We note that the above proof uses the fact that calculus with trigonometric functions must be done with radians and not degrees. In other words, we had to change the range of integration to [-\pi/2,\pi/2] and not [-90^o, 90^o].

Area of a circle (Part 1)

Math majors are completely comfortable with the formula A = \pi r^2 for the area of a circle. However, they often tell me that they don’t remember a proof or justification for why this formula is true. And they certainly don’t remember a justification that would be appropriate for showing geometry students.

In this series of posts, I’ll discuss several ways that the area of a circle can be found using calculus. I’ll also discuss a straightforward classroom activity by which students can discover for themselves why A = \pi r^2.green lineIn the first few weeks after a calculus class, after students are introduced to the concept of limits, the derivative is introduced for the first time… often as the slope of a tangent line to the curve. Here it is: if $y = f(x)$, then

\displaystyle \frac{dy}{dx} = y' = f'(x) = \lim_{h \to 0} \displaystyle \frac{f(x+h) - f(x)}{h}

From this definition, the first few rules of differentiation are derived in approximately the following order:

1. If f(x) = c, a constant, then \displaystyle \frac{d}{dx} (c) = 0.

2. If f(x) and g(x) are both differentiable, then (f+g)'(x) = f'(x) + g'(x).

3. If f(x) is differentiable and c is a constant, then (cf)'(x) = c f'(x).

4. If f(x) = x^n, where n is a nonnegative integer, then f'(x) = n x^{n-1}. This may be proved by at least two different techniques:

  • The binomial expansion (x+h)^n = x^n + n x^{n-1} h + \displaystyle {n \choose 2} x^{n-2} h^2 + \dots + h^n
  • The Product Rule (derived later) and mathematical induction

5. If f(x) = a_n x^n + a_{n-1} x^{n-1} + \dots + a_1 x + a_0 is a polynomial, then f'(x) = n a_n x^{n-1} + (n-1) a_{n-1} x^{n-2} + a_1. In other words, taking the derivative of a polynomial is easy.

After doing a few examples to help these concepts sink in, I’ll show the following two examples with about 3-4 minutes left in class.

Example 1. Let A(r) = \pi r^2. Notice I’ve changed the variable from x to r, but that’s OK. Does this remind you of anything? (Students answer: the area of a circle.) What’s the derivative? Remember, \pi is just a constant. So A'(r) = \pi \cdot 2r = 2\pi r
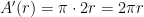
. Does this remind you of anything? (Students answer: Whoa… the circumference of a circle.)

Example 2. Now let’s try V(r) = \displaystyle \frac{4}{3} \pi r^3. Does this remind you of anything? (Students answer: the volume of a sphere.) What’s the derivative? Again, \displaystyle \frac{4}{3} \pi is just a constant. So V'(r) = \displaystyle \frac{4}{3} \pi \cdot 3r^2 = 4\pi r^2. Does this remind you of anything? (Students answer: Whoa… the surface area of a sphere.)

Hmmm. That’s interesting. The derivative of the area of a circle is the circumference of the circle, and the derivative of the area of a sphere is the surface area of the sphere. I wonder why this works. Any ideas? (Students: stunned silence.)

This is what’s known on television as a cliff-hanger, and I’ll give you the answer at the start of class tomorrow. (Students groan, as they really want to know the answer immediately.)

In the spirit of a cliff-hanger, I offer the following thought bubble before presenting the answer.

green_speech_bubble

By definition, if A(r) = \pi r^2, then

A'(r) = \displaystyle \lim_{h \to 0} \frac{ A(r+h) - A(r) }{h} = 2\pi r

The numerator may be viewed as the area of the ring between concentric circles with radii r and r+h. In other words, imagine starting with a solid red disk of radius r +h and then removing a solid white disk of radius r. The picture would look something like this:

ring

Notice that the ring has a thickness of r+h -r = h
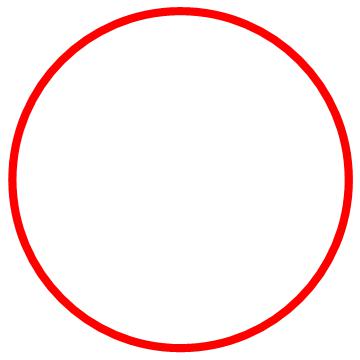
. If this ring were to be “unpeeled” and flattened, it would approximately resemble a rectangle. The height of the rectangle would be h, while the length of the rectangle would be the circumference of the circle. So

A(r + h) - A(r) \approx 2 \pi r h

and we can conclude that

A'(r) = \displaystyle \lim_{h \to 0} \frac{ 2 \pi r h}{h} = 2\pi r

By the same reasoning, the derivative of the volume of a sphere ought to be the surface area of the sphere.

Pedagogically, I find that the above discussion helps reinforce the definition of a derivative at a time when students are most willing to forget about the formal definition in favor of the various rules of differentiation.

green line

In the above work, we started with the formula for the area of the circle and then confirmed that its derivative matched the expected result. However, the above logic can be used to derive the formula for the area of a circle from the formula $C(r) = 2\pi r$ for the circumference. We begin with the observation that A'(r) = C(r)
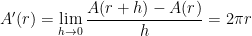
, as above. Therefore, by the Fundamental Theorem of Calculus,

A(r) - A(0) = \displaystyle \int_0^r C(t) \, dt

A(r) - A(0) = \displaystyle \int_0^r 2\pi t \, dt

A(r) - A(0) = \displaystyle \left[ \pi t^2 \right]_0^r

A(r) - A(0) = \pi r^2

Since the area of a circle with radius 0 is 0, we conclude that A(r) = \pi r^2.

Pedagogically, I don’t particularly recommend this approach, as I think students would find this explanation more confusing than the first approach. However, I can see that this could be useful for reinforcing the statement of the Fundamental Theorem of Calculus.

green line

By the way, the above reasoning works for a square or cube also, but with a little twist. For a square of side length s, the area is A(s) = s^2 and the perimeter is P(s) = 4s, which isn’t the derivative of A(s). The reason this didn’t work is because the side length s of a square corresponds to the diameter of a circle, not the radius of a circle.

But, if we let x denote half the side length of a square, then the above logic works out since

A(x) = s^2 = (2x)^2 = 4x^2

and

P(x) = 4s = 4(2x) = 8x

Written in terms of the half-sidelength x, we see that A'(x) = P(x).