In my capstone class for future secondary math teachers, I ask my students to come up with ideas for engaging their students with different topics in the secondary mathematics curriculum. In other words, the point of the assignment was not to devise a full-blown lesson plan on this topic. Instead, I asked my students to think about three different ways of getting their students interested in the topic in the first place.
I plan to share some of the best of these ideas on this blog (after asking my students’ permission, of course).
This student submission comes from my former student Jessica Williams. Her topic, from Algebra I: the point-slope intercept form of a line.

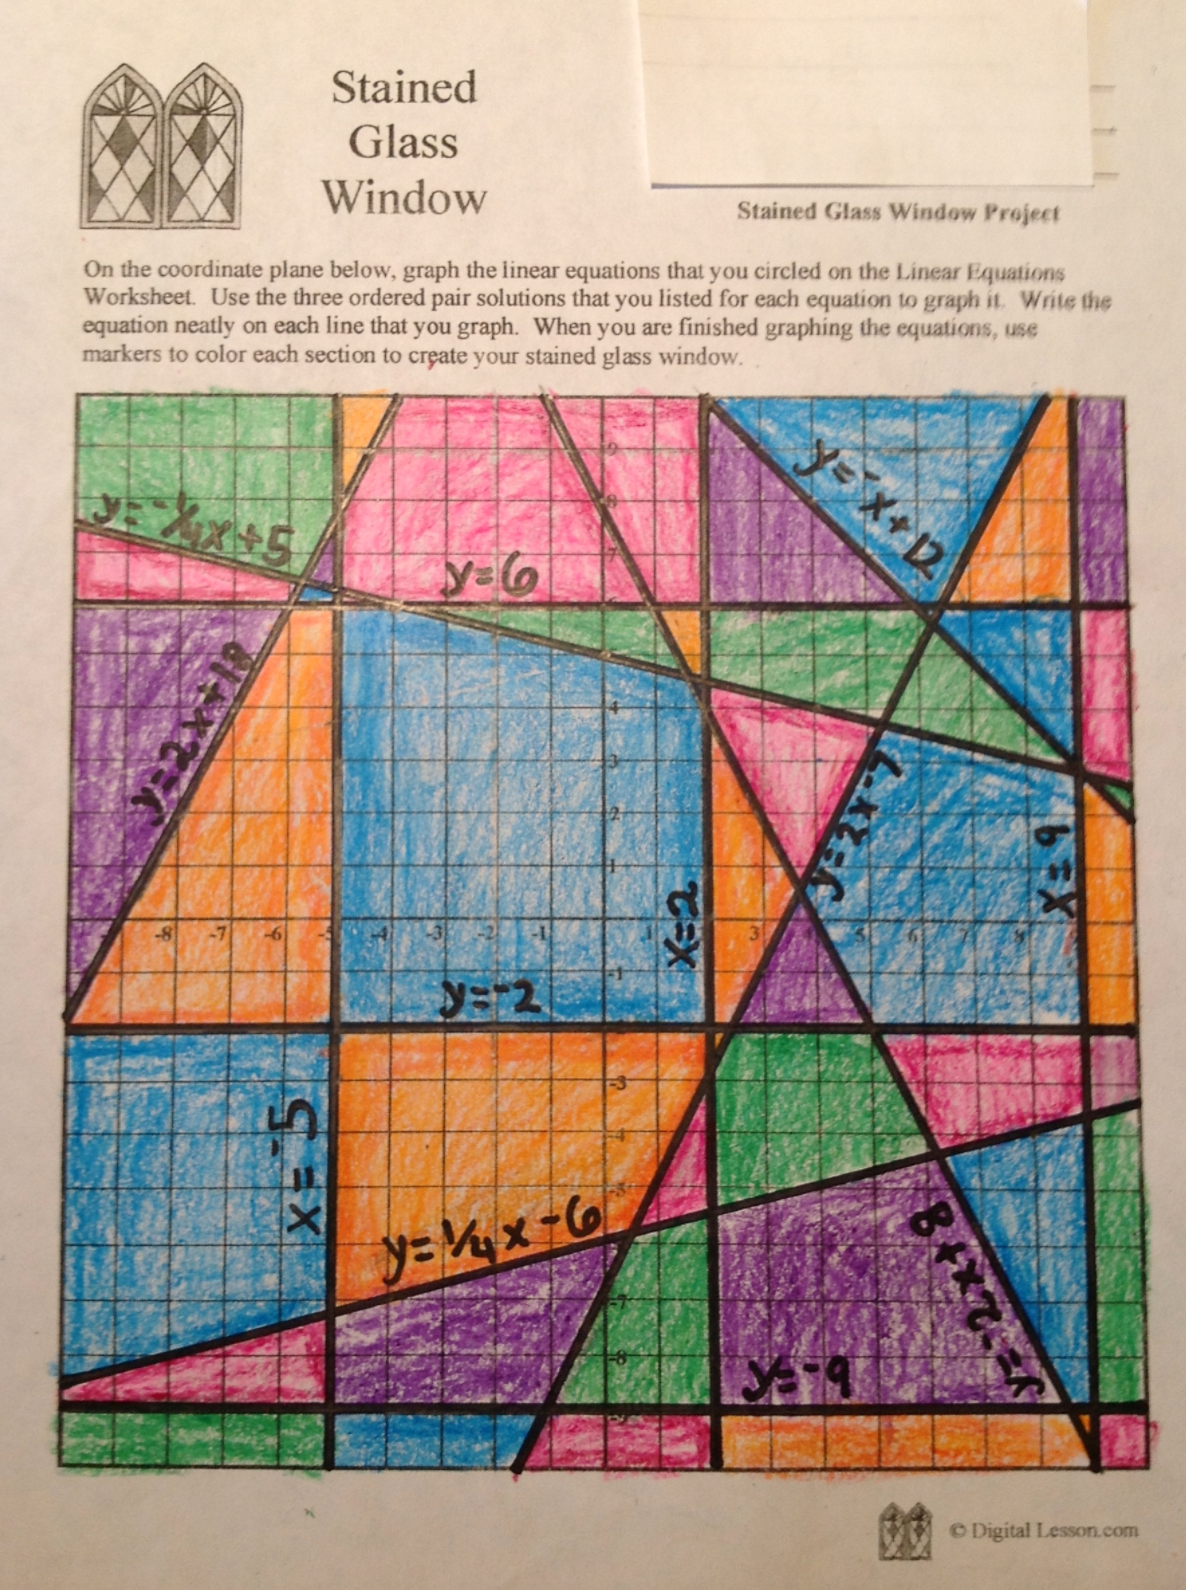
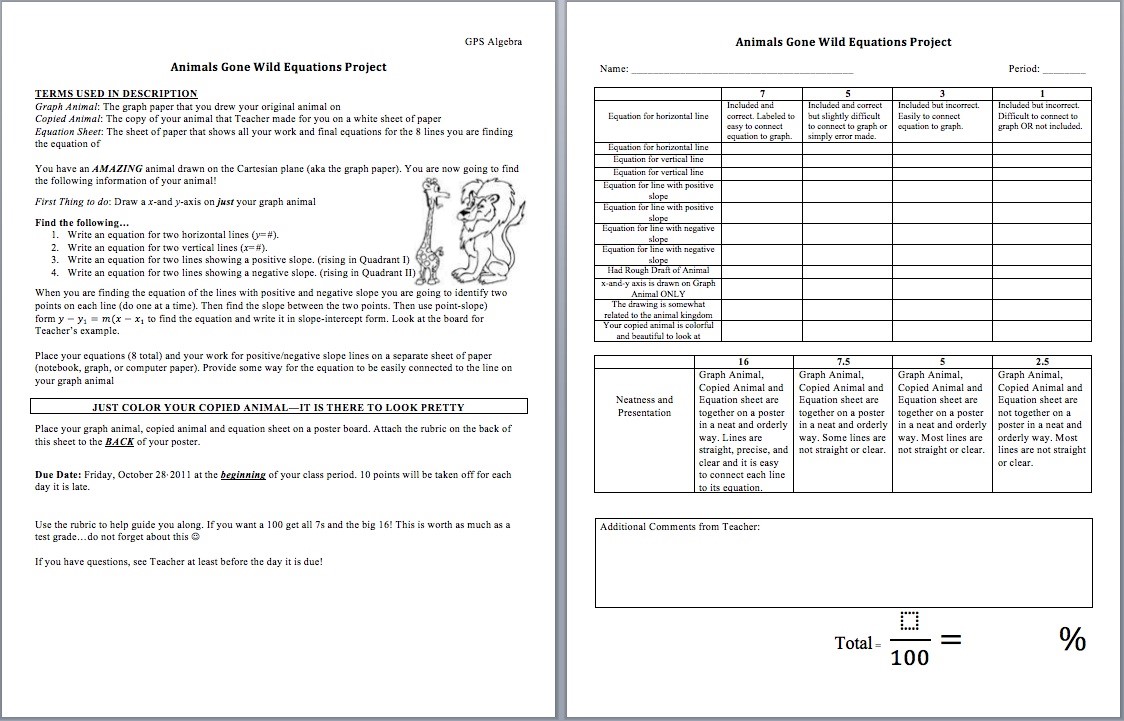
A.2 How could you as a teacher create an activity or project that involves your topic?
In order to teach a lesson regarding slope intercept form of a line, I believe it is crucial to use visual learning to really open the student’s minds to the concept. Prior to this lesson, students should know how to find the slope of a line. I would provide each student with a piece of graph paper and small square deli sheet paper. I would have them fold their deli sheet paper into half corner to corner/triangle way). I would ask each student to put the triangle anywhere on the graph so that it passes through the x and the y-axis. Then I will ask the students to trace the side of the triangle and to find two points that are on that line. For the next step, each student will find the slope of the line they created. Once the students have discovered their slope, I will ask each of them to continue their line further using the slope they found. I will ask a few students to show theirs as an example (picking the one who went through the origin and one who did not). I will scaffold the students into asking what the difference would look like in a formula if you go through the origin or if you go through (0,4) or (0,-3) and so on. Eventually the students will come to the conclusion how the place where their line crosses the y-axis is their y intercept. Lastly, each student will be able to write their equation of the line they specifically created. I will then introduce the y=mx+b formula to them and show how the discovery they found is that exact formula. This is a great way to allow the students to work hands on with the material and have their own individual accountability for the concept. They will have the pride of knowing that they learned the slope intercept formula of a line on their own.
E.1 How can technology (YouTube, Khan Academy [khanacademy.org], Vi Hart, Geometers Sketchpad, graphing calculators, etc.) be used to effectively engage students with this topic?
Graphing calculators are a very important aspect of teaching slope-intercept form of a line. It allows the students to visually see where the y-intercept is and what the slope is. Also, another good program to use is desmos. It allows the students to see the graph on the big screen and you can put multiple graphs on the screen at one time to see the affects that the different slopes and y intercept have on the graph. This leads students into learning about transformations of linear functions. Also, the teacher can provide the students with a graph, with no points labeled, and ask them to find the equation of the line on the screen. This could lead into a fun group activity/relay race of who can write the formula of the graph in the quickest time. Also, khan academy has a graphing program where the students are asked to create the graph for a specific equation. This allows the students to practice their graphing abilities and truly master the concept at home. To engage the students, you could also use Kahoot to practice vocabulary. For Kahoot quizzes, you can set the time for any amount up to 2 minutes, so you could throw a few formula questions in their as well. It is an engaging way to have each student actively involved and practicing his or her vocabulary.
B1. How can this topic be used in your students’ future courses in mathematics or science?
Learning slope intercept form is very important for the success of their future courses and real world problems. Linear equations are found all over the world in different jobs, art, etc. By mastering this concept, it is easier for students to visualize what the graph of a specific equation will look like, without actually having to graph it. The students will understand that the b in y=mx+b is the y-intercept and they will know how steep the graph will be depending on the value of m. Mastering this concept will better prepare them to lead into quadratic equations and eventually cubic. Slope intercept form is the beginning of what is to come in the graphing world. Once you grasp the concept of how to identify what the graph will look like, it is easier to introduce the students to a graph with a higher degree. It will be easier to explain how y=mx+b is for linear graphs because it is increases or decreases at a constant rate. You could start by asking,
1.What about if we raise the degree of the graph to x^2?
2.What will happen to the graph?
3.Why do you think this will happen, can you explain?
4.What does squaring the x value mean?
It really just prepares the students for real world applications as well. When they are presented a problem in real life, for example, the student is throwing a bday party and has $100 dollars to go to the skating rink. If they have to spend $20 on pizza and each friend costs $10 to take, how many friends can you take? Linear equations are used every day, and it truly helps each one of the students.


 and
and  .
.
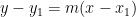
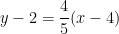

 and
and  is also equal to
  .
.
 and
and  to solve for
  .
.

 is differentiable, then the tangent line to the curve
  at the point
  has slope
  . Therefore, the equation of the tangent line (or the
 . The solution is called the regression line, which has the form
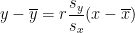
 and
and  are the means of the
  and
and  values, respectively.
 and
and  are the sample standard deviations of the
  is the correlation coefficient between the
  .
.