Engaging students: Slope-intercept form of a line

In my capstone class for future secondary math teachers, I ask my students to come up with ideas for engaging their students with different topics in the secondary mathematics curriculum. In other words, the point of the assignment was not to devise a full-blown lesson plan on this topic. Instead, I asked my students to think about three different ways of getting their students interested in the topic in the first place.

I plan to share some of the best of these ideas on this blog (after asking my students’ permission, of course).

This student submission comes from my former student Fidel Gonzales. His topic, from Algebra I: the point-slope intercept form of a line.

green line

How can technology (YouTube, Khan Academy [khanacademy.org], Vi Hart, Geometers Sketchpad, graphing calculators, etc.) be used to effectively engage students with this topic?

Note: It’s not enough to say “such-and-such is a great website”; you need to explain in some detail why it’s a great website.

Technology is always advancing right in front of us. Using it in the classroom can be a tool that allows students to have a more hands on experience in the classroom. When I was in middle school, the only tool that we had to learn slope intercept form of a line was using a ti-inspire calculator. However, schools are receiving more funding and can provide students with tablets or computers to assist in their academic career. Gizmos is a website that contains many user-friendly programs that a student can use to learn a concept, or an educator can present to reinforce a skill. For the topic of slope intercept form of a line, the gizmo has two sliding parts that allows the user to change the values of the equation. One for the slope and one for the y- intercept. The student can adjust the values of both and observe the changes that occur to the line. This experience is more user friendly since it only allows the person to change those two aspects compared to having to input the equation each time into the graphing calculator. The reason that students would be more likely to be engaged is because they are already used to technology and there is still a need to incorporate technology into the classroom. So, students would prefer using a computer compared to the traditional paper and pencil. Imagine them having to graph by hand each graph to compare differences!

green line

How could you as a teacher create an activity or project that involves your topic?

Slope intercept form is a way that data can be displayed. The data is usually continuously decreasing or continuously increasing. There is a magnitude of activities that can be used to help students gather a better understanding of the topic. As an educator, I would create a scavenger hunt that displayed either a word problem or a graph. Both will ask for the student to represent the information as slope intercept form. For each problem, there will be 4 answer choices that the student could choose for their answer. On their worksheet, there will be fill in the blanks that will be filled up from the letter that is in front of the correct answer. As the student progresses to the next problem, they will be filling out the letter blanks in a random order. So, if the person does the activity correctly, they should end up with the correct word phrase. The word phrase will be a math pun to add to the magic. This activity will allow students to switch from graph and word problems to slope intercept form.

green line

How does this topic extend what your students should have learned in previous courses?

As educators, we want to ensure that our students have the proper foundation to continue advancing their mathematic skills. Slope intercept form is an algebra base lesson. The skills that students used to reach this topic is addition. At a young age, students learn to count numbers in repeated increments. An example of this is when a student keeps adding 5 until they reach a certain number. Displaying this as slope intercept would be a line with no y intercept and a slope of 5. We have even used y intercepts in context to adding in past classes. An example of this would be a person wanting to sell 200 dollars’ worth of tickets that are worth 5 dollars each and they already started with 57 dollars. If they were to solve the problem using slope intercept form, they would put 200 as the y value and 57 as the y intercept of the problem. The slope would be 5. In the past, they would add 5 to 57 until they reach their goal. Slope intercept form is a way for students to display data with a constant increasing or decreasing value. It is more convenient for students to use slope intercept form compared to how they displayed the pattern in the past. They use it now since they learned why it works before they reach algebra.

References:

https://www.geogebra.org/about


Engaging students: Slope-intercept form of a line

In my capstone class for future secondary math teachers, I ask my students to come up with ideas for engaging their students with different topics in the secondary mathematics curriculum. In other words, the point of the assignment was not to devise a full-blown lesson plan on this topic. Instead, I asked my students to think about three different ways of getting their students interested in the topic in the first place.

I plan to share some of the best of these ideas on this blog (after asking my students’ permission, of course).

This student submission comes from my former student Michael Garcia. His topic, from Algebra I: the point-slope intercept form of a line.

green line

How does this topic extend what your students should have learned in previous courses?

Writing linear function in slope-intercept form is an important topic in Algebra I. The slope-intercept form of a line consists of an independent and dependent variable, a slope, and a y-intercept. In previous courses, the students should have learned slope. They may not have learned specifically about the word “slope,” but they should have been introduced to the topic of rate of change. The students also should have been introduced to the topic of graphing, specifically graphing a point on a Cartesian coordinate plane. Finally, the students should have learned about independent and dependent variables.

The slope-intercept form of a line extends the concept of rate of change, graphing, and independent/dependent variables by “putting it all together.” Students now have their first glimpse into the world of graphing equations. They can now visually see the representation of the rate of change (or slope) between the different points of a line. The students can see how the slope is a constant rate that goes through our points of data.

green line

How has this topic appeared in the news?

On September 12, 2018, Apple held its annual news conference. They announced plenty of new gear and updates to their IOS, but everyone tuned in to hear about the new iPhone. The world freaked out when the new iPhone XS, iPhone XS Max, and iPhone XR were announced. So, how does this announcement relate to the slope-intercept form of a line? If we wanted to purchase a new iPhone and have a cell service plan with it, we can write a linear equation.

According to the Apple website, you can purchase the iPhone XS for $999, while you can purchase the iPhone XS Max for as little as $1,099. However, those price points are for the 64 GB model. If we are going to purchase an iPhone, we are going to buy the biggest and flashiest model. Since the iPhone XR is not currently taking pre-orders, we are going to purchase an iPhone XS Max with 512 GB of storage for $1,449. Since most people cannot afford to spend $1,449 on a single item, we are going to have monthly payments of $68.66.

According to an Apple sales representative I spoke on the phone with, there would not be a down payment on this iPhone model.* Also, according to my mom’s phone bill, it would cost $40 a month for one cell phone line that has unlimited talking, but 0.05 cents per text (my mom doesn’t text) . Our linear equation would be y= 0.05x +68.66 + 40, which is the same as y= 0.05x + 108.66.

This is a great way of viewing linear functions in slope-intercept form because it makes the problem more personable to the student.


*given that the customer signs up for the Apple iPhone Upgrade program


green line

How can technology (YouTube, Khan Academy [khanacademy.org], Vi Hart, Geometers Sketchpad, graphing calculators, etc.) be used to effectively engage students with this topic?

With new technology coming out every day, there are plenty of resources available for teachers. One tool that can be used to engage students with the slope-intercept form of a line is an application called GeoGebra. GeoGebra is “dynamic mathematics software for all levels of education that brings together geometry, algebra, spreadsheets, graphing, statistics and calculus in one easy-to-use package.” There are online resources already created (very similar to Desmos), but I would mainly use their external app. I would use GeoGebra because of the many possibilities that are provided within the app.

The beauty of GeoGebra is student can utilize this app in their studying time as well. When you plot two points, the application automatically writes the equation associated with the line. This is a great way for the student to check their work when graphing/writing linear equation in slope-intercept form.

References:

https://www.apple.com/shop/buy-iphone/iphone-xs/6.5-inch-display-512gb-space-gray-sprint#01,11,31,42

https://www.geogebra.org/about


Engaging students: Slope-intercept form of a line

In my capstone class for future secondary math teachers, I ask my students to come up with ideas for engaging their students with different topics in the secondary mathematics curriculum. In other words, the point of the assignment was not to devise a full-blown lesson plan on this topic. Instead, I asked my students to think about three different ways of getting their students interested in the topic in the first place.

I plan to share some of the best of these ideas on this blog (after asking my students’ permission, of course).

This student submission comes from my former student Jessica Williams. Her topic, from Algebra I: the point-slope intercept form of a line.

green line

A.2 How could you as a teacher create an activity or project that involves your topic?

In order to teach a lesson regarding slope intercept form of a line, I believe it is crucial to use visual learning to really open the student’s minds to the concept. Prior to this lesson, students should know how to find the slope of a line. I would provide each student with a piece of graph paper and small square deli sheet paper. I would have them fold their deli sheet paper into half corner to corner/triangle way). I would ask each student to put the triangle anywhere on the graph so that it passes through the x and the y-axis. Then I will ask the students to trace the side of the triangle and to find two points that are on that line. For the next step, each student will find the slope of the line they created. Once the students have discovered their slope, I will ask each of them to continue their line further using the slope they found. I will ask a few students to show theirs as an example (picking the one who went through the origin and one who did not). I will scaffold the students into asking what the difference would look like in a formula if you go through the origin or if you go through (0,4) or (0,-3) and so on. Eventually the students will come to the conclusion how the place where their line crosses the y-axis is their y intercept. Lastly, each student will be able to write their equation of the line they specifically created. I will then introduce the y=mx+b formula to them and show how the discovery they found is that exact formula. This is a great way to allow the students to work hands on with the material and have their own individual accountability for the concept. They will have the pride of knowing that they learned the slope intercept formula of a line on their own.


green line

E.1 How can technology (YouTube, Khan Academy [khanacademy.org], Vi Hart, Geometers Sketchpad, graphing calculators, etc.) be used to effectively engage students with this topic?

Graphing calculators are a very important aspect of teaching slope-intercept form of a line. It allows the students to visually see where the y-intercept is and what the slope is. Also, another good program to use is desmos. It allows the students to see the graph on the big screen and you can put multiple graphs on the screen at one time to see the affects that the different slopes and y intercept have on the graph. This leads students into learning about transformations of linear functions. Also, the teacher can provide the students with a graph, with no points labeled, and ask them to find the equation of the line on the screen. This could lead into a fun group activity/relay race of who can write the formula of the graph in the quickest time. Also, khan academy has a graphing program where the students are asked to create the graph for a specific equation. This allows the students to practice their graphing abilities and truly master the concept at home. To engage the students, you could also use Kahoot to practice vocabulary. For Kahoot quizzes, you can set the time for any amount up to 2 minutes, so you could throw a few formula questions in their as well. It is an engaging way to have each student actively involved and practicing his or her vocabulary.

green line

B1. How can this topic be used in your students’ future courses in mathematics or science?

Learning slope intercept form is very important for the success of their future courses and real world problems. Linear equations are found all over the world in different jobs, art, etc. By mastering this concept, it is easier for students to visualize what the graph of a specific equation will look like, without actually having to graph it. The students will understand that the b in y=mx+b is the y-intercept and they will know how steep the graph will be depending on the value of m. Mastering this concept will better prepare them to lead into quadratic equations and eventually cubic. Slope intercept form is the beginning of what is to come in the graphing world. Once you grasp the concept of how to identify what the graph will look like, it is easier to introduce the students to a graph with a higher degree. It will be easier to explain how y=mx+b is for linear graphs because it is increases or decreases at a constant rate. You could start by asking,
1.What about if we raise the degree of the graph to x^2?
2.What will happen to the graph?
3.Why do you think this will happen, can you explain?
4.What does squaring the x value mean?
It really just prepares the students for real world applications as well. When they are presented a problem in real life, for example, the student is throwing a bday party and has $100 dollars to go to the skating rink. If they have to spend $20 on pizza and each friend costs $10 to take, how many friends can you take? Linear equations are used every day, and it truly helps each one of the students.

References:
https://www.khanacademy.org/math/algebra/two-var-linear-equations/graphing-slope-intercept-equations/e/graph-from-slope-intercept-equation


Finding the equation of a line between two points

Here’s a standard problem that could be found in any Algebra I textbook.

Find the equation of the line between (-1,-2) and (4,2).

The first step is clear: the slope of the line is

m = \displaystyle \frac{2-(-2)}{4-(-1)} = \frac{4}{5}

At this point, there are two reasonable approaches for finding the equation of the line.

Method #1. This is the method that was hammered into my head when I took Algebra I. We use the point-slope form of the line:

y - y_1 = m (x - x_1)

y - 2 = \displaystyle \frac{4}{5} (x-4)

y - 2 = \displaystyle \frac{4}{5}x - \frac{16}{5}

y = \displaystyle \frac{4}{5}x - \frac{6}{5}

For what it’s worth, the point-slope form of the line relies on the fact that the slope between (x,y) and (x_1,y_1) is also equal to m.

Method #2. I can honestly say that I never saw this second method until I became a college professor and I saw it on my students’ homework. In fact, I was so taken aback that I almost marked the solution incorrect until I took a minute to think through the logic of my students’ solution. Let’s set up the slope-intercept form of a line:

y= \displaystyle \frac{4}{5}x + b

Then we plug in one of the points for x and y to solve for b.

2 = \displaystyle \frac{4}{5}(4) + b

\displaystyle -\frac{6}{5} = b

Therefore, the line is y = \displaystyle \frac{4}{5}x - \frac{6}{5}.

green lineMy experience is that most college students prefer Method #2, and I can’t say that I blame them. The slope-intercept form of a line is far easier to use than the point-slope form, and it’s one less formula to memorize.

Still, I’d like to point out that there are instances in courses above Algebra I that the point-slope form is really helpful, and so the point-slope form should continue to be taught in Algebra I so that students are prepared for these applications later in life.

Topic #1. In calculus, if f is differentiable, then the tangent line to the curve y=f(x) at the point (a,f(a)) has slope f'(a). Therefore, the equation of the tangent line (or the linearization) has the form

y = f(a) + f'(a) \cdot (x-a)

This linearization is immediately obtained from the point-slope form of a line. It also can be obtained using Method #2 above, so it takes a little bit of extra work.

This linearization is used to derive Newton’s method for approximating the roots of functions, and it is a precursor to Taylor series.

Topic #2. In statistics, a common topic is finding the least-squares fit to a set of points (x_1,y_1), (x_2,y_2), \dots, (x_n,y_n). The solution is called the regression line, which has the form
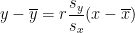
y - \overline{y} = r \displaystyle \frac{s_y}{s_x} (x - \overline{x})

In this equation,

  • \overline{x} and \overline{y} are the means of the x- and y-values, respectively.
  • s_x and s_y are the sample standard deviations of the x- and y-values, respectively.
  • r is the correlation coefficient between the x- and y-values.

The formula of the regression line is decidedly easier to write in point-slope form than in slope-intercept form. Also, the point-slope form makes the interpretation of the regression line clear: it must pass through the point of averages (\overline{x}, \overline{y}).

Engaging students: Slope-intercept form of a line

In my capstone class for future secondary math teachers, I ask my students to come up with ideas for engaging their students with different topics in the secondary mathematics curriculum. In other words, the point of the assignment was not to devise a full-blown lesson plan on this topic. Instead, I asked my students to think about three different ways of getting their students interested in the topic in the first place.

I plan to share some of the best of these ideas on this blog (after asking my students’ permission, of course).

This student submission comes from my former student Theresa (Tress) Kringen. Her topic, from Algebra I: the point-slope intercept form of a line.

green line

What interesting word problem using this topic can your students do now?

When learning about slope-intercept from of a line, word problems would help my students engage and help process the information in a real world situation. I would present an equation for the speed of a ball that is thrown in a straight line up into the air. The equation given: v= 128-32t. I would explain that because we’re working with time and speed, height is not a variable in the equation. With v representing the speed or velocity of the ball in feet per second and t representing the time in seconds that has passed. I would include the following questions:

1. What is the slope of the given equation? Since the equation is given in slope intercept form, the students should be able to give the answer quickly if they understood the lesson. The answer is -32.

2. Without graphing the equation, which way would the line be headed, up and to the right or down and to the right? Because the students know that the slope is negative and given that they understood the lesson, they should be able to answer that the line is decreasing and is headed down and to the right.

http://www.purplemath.com/modules/slopyint.htm

green line

How can this topic be used in your students’ future courses in mathematics or science?

Students can use this topic for many math or science courses. When dealing with a linear equation, slope-intercept form of a line can help the student understand what the graph looks like without actually graphing it. This is useful when needing to find the y intercept (when x is equal to zero) and what the slope of the line is. This is also useful to know for understanding what slope is. When students understand that a slope of a particularly large number (a large whole number such as 1,000 or an improper fraction that equates to a large number such as 30,999/2) is rising quickly as opposed to a slope of a smaller number  (a smaller whole number such as two or a fraction that represents a very small portion of one such as 1/30,000) which is not rising quickly. It is helpful for the students to understand that a very large slope will look almost vertical and a small slope will look almost horizontal, with both depending on the degree of largeness or smallness.

green line

How can technology be used to effectively engage students with this topic?

When working with slope-intercept form, a student can actively be engaged through technology by attempting to make connections of how a graph looks on the graphing calculator and what the equation looks like in slope-intercept form. When allowing the students to make connections between them in small groups, they will have discovered the information form themselves. This will allow the students to more effectively program the information into their memories. To set this up, I would give each group a graphing calculator and a list of equations in slope-intercept form. On the paper with the list, I would have the students fill out information pertaining to the graph that they see. This information would include the slope and the y-intercept. I would split up the students into their cooperative learning groups two and ask them to draw a conclusion between where the line ends up compared to what the equation looks like. Once the students have typed their equation into the graphing calculator the students should fill out the paper provided. Once they have finished, I would ask them to see if they see any patterns between the equations and their answers.