Engaging students: Perimeters of polygons

In my capstone class for future secondary math teachers, I ask my students to come up with ideas for engaging their students with different topics in the secondary mathematics curriculum. In other words, the point of the assignment was not to devise a full-blown lesson plan on this topic. Instead, I asked my students to think about three different ways of getting their students interested in the topic in the first place.

I plan to share some of the best of these ideas on this blog (after asking my students’ permission, of course).

This student submission comes from my former student Tiffany Wilhoit. Her topic, from Geometry: perimeters of polygons.

green line

How could you as a teacher create an activity or project that involves your topic?


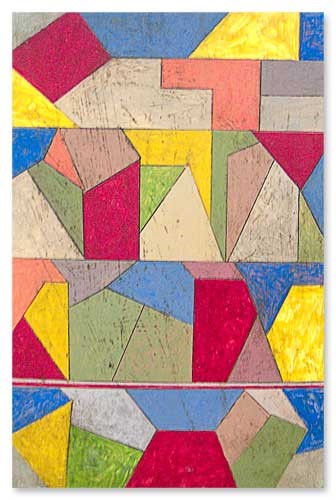
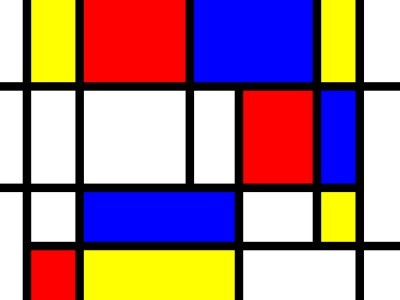
Most activities around the topic of perimeter involve building a fence or a border. However, I feel as if that idea has been overused, and become boring to the students. One activity you could have your students do is to create a piece of art using polygons. There are many artists which create pieces of art using geometric shapes, such as Piet Mondrian. There are two different ways you could do this. The first could be to create a piece of work using polygons of various sizes and structures. The students could then calculate the perimeter of each polygon in their piece of art. There could be a minimum number of polygons the student must use, and you can put extra restrictions on how many different types of polygons the students must use as well. This would provide the students extra practice on determining perimeter of various polygons. Another way to do the project is to have the students create a piece of art using various polygons with the same perimeter. This would allow the students to see how shapes (and area) can change according to how the perimeter is arranged. The students would be able to grasp the idea of two (or more) polygons having the same perimeter, but being different sizes. Either one of these projects would allow the students to discover math while enjoying art.

polygon1polygon2

green line

How does this topic extend what your students should have learned in previous courses?


Students learn about perimeter starting in elementary school. The students learn to add up the four sides of a rectangle or square. Elementary students deal with very basic shapes, and discover the basic meaning of perimeter. As the students go through school the difficulty of the problems increases. The students learn about multiplying the length of one side by the number of sides to find the perimeter of a regular polygon. Soon, the students have to solve for missing sides. First they have to be aware that some sides are equal to other sides, and they just plug in the numbers. Then the students will use algebra to solve for the sides labeled as X or X plus some amount. The students continue to see perimeter throughout calculus. In calculus, the students will be asked to minimize or maximize the perimeter. The students see the topic or perimeter throughout their schooling, so it is necessary for them to have a good understanding of the topic.


green line

How can technology be used to effectively engage students with this topic?


There are several videos on Youtube with songs about perimeter to engage your students. One of the best ones I found was at http://www.youtube.com/watch?v=wynwRcc5q_U.

This video was a little silly, but it shared the idea of perimeter of polygons, and I think the students would enjoy it. The graphics are constantly changing which will help keep the attention of the students. This video shows some examples of polygons and their perimeter. However, the video only uses rectangles and triangles. One good point of the video is when it shows how to find the missing sides of different rectangles, however, by high school the students should already have a grasp on this. Nevertheless, it is still an engaging.


Another video I found to be very engaging can be found at http://www.youtube.com/watch?v=Xk-PyhjFWw4.

This video uses the beat of a song, but changes the words to discuss perimeter. I liked this video because it gave the examples of building a fence or walking around the block. These are examples the student would know already, and they would be able to remember if they needed help distinguishing between area and perimeter. The last half of the song discusses area. You could choose to play the entire video or just the portion on perimeter.


The last video can be found at http://www.youtube.com/watch?v=AAY1bsazcgM.

This video is an excellent review all about perimeter. The video goes into the topic pretty deeply, and would make a great review for the students. The video discusses the importance of units since perimeter is a measurement. It goes over a variety of topics, such as using multiplication to find perimeter of regular polygons, how to find missing sides of polygons, irregular polygons, and it even discusses why perimeter is one dimensional. This video is very informative, however, it is not the most engaging video, so it might be better off used as a review, or for the students having trouble.


Resources:

http://www.theartstory.org/artist-mondrian-piet.htm

http://www.teresacerda.com/teresacerdageometry.html

http://www.youtube.com/watch?v=AAY1bsazcgM

http://www.youtube.com/watch?v=wynwRcc5q_U

http://www.youtube.com/watch?v=Xk-PyhjFWw4


Value Added Meets the Schools: The Effects of Using Test-Based Teacher Evaluation on the Work of Teachers and Leaders

The March 2015 issue of Educational Researcher was devoted to the perceived usefulness/uselessness (depending on the perceiver) of high-stakes testing. The issue contains multiple perspectives from teachers, principals, and education researchers. The abstract from the journal’s editors sets the tone for the issue:

Teacher accountability based on teacher value-added measures could have far-reaching effects on classroom instruction
and student learning, for good and for ill. To date, however, research has focused almost entirely on the statistical
properties of the measures. While a useful starting point, the validity and reliability of the measures tell us very little
about the effects on teaching and learning that come from embedding value added into policies like teacher evaluation,
tenure, and compensation. We pose dozens of unanswered questions, not only about the net effects of these policies on
measurable student outcomes, but about the numerous, often indirect ways in which these and less easily observed effects
might arise. Drawing in part on other articles in the special issue, we consider perspectives from labor economics, sociology
of organizations, and psychology. Some of the pathways of these policy effects directly influence teaching and learning
and in intentional ways, while other pathways are indirect and unintentional. While research is just beginning to answer the
key questions, a key initial theme of recent research is that both the opponents and advocates are partly correct about the
influence of these policies.

Engaging students: Graphing with polar coordinates

In my capstone class for future secondary math teachers, I ask my students to come up with ideas for engaging their students with different topics in the secondary mathematics curriculum. In other words, the point of the assignment was not to devise a full-blown lesson plan on this topic. Instead, I asked my students to think about three different ways of getting their students interested in the topic in the first place.

I plan to share some of the best of these ideas on this blog (after asking my students’ permission, of course).

This student submission comes from my former student Laura Lozano. Her topic, from Precalculus: graphing with polar coordinates.


green line

How could you as a teacher create an activity or project that involves your topic?

An activity that I believe will go really well with graphing polar coordinates or any type of graphing lesson will be to convert the classroom floor into a graph. Also, I will have a selection of random objects like, a rubber ducky, boat, toy, etc. The size of the graph will depend on the size of classroom of course. If the classroom is really small then I would have to take this activity outdoors or maybe even the gym or anywhere with enough room for the graph and my students. The graph doesn’t have to be super big but I would use a graph no smaller than 8 feet by 8 feet area. I could create the graph lines with tape on the floor or draw them on big paper and tape the paper on the floor. I would start the activity with first talking about points on a Cartesian graph. An example could be to first have a students plot a couple points like (5, 4), (3, 6), or (-4, 2) on the board. Then transition them from Cartesian to polar coordinates by using the floor graph and have them discover how they relate by using the x and y coordinates to find the radius and the angle. Then later, after they get the hang of it, I would have the class split up into groups of two and let them choose an object, like a rubber ducky, boat, or toy, to set on the graph and have them write and tell me the point of their object.


green line

We see radars in the news almost all the time. One category that it is usually used in is weather. The weather center uses their radars to detect for any water particles, debris, and basically anything that is in the air that could be approaching. The way that they tell if a storm or any other weather change is coming is by the radar’s omitting radio waves. The radar omits waves that then come back to the radar if the waves clash with anything in the air. The radar can detect how far an object is by the time it takes for the wave to come back. It works just like an echo! Also, recently with the search of the Malaysian airplane, we saw it used more. The news will show a clip of aircraft radar or ship radar searching for something in the air or in the ocean. Radars look almost exactly like a polar graph does. On the left is a regular polar graph. On the right is a ship’s radar. Both graphs have angles with circles.

polar1

polar2


green line

How can technology (YouTube, Khan Academy [khanacademy.org], Vi Hart, Geometers Sketchpad, graphing calculators, etc.) be used to effectively engage students with this topic? Note: It’s not enough to say “such-and-such is a great website”; you need to explain in some detail why it’s a great website.

Graphing calculators can be used to discover polar coordinates and polar equations. I would first tell them to take out their calculators and just type in a random number from -10 to 10. I choose this interval because the graphing calculators have this window preset for graphing. I number that I randomly chose was the number 4. So I would go to the “Y=” button and type in 4. Then I would hit “GRAPH” and I should get a straight line horizontal line going through the y-axis at 4. I would then change the calculator mode and change from “FUNC” to “POL”. Then I would tell them to do the exact thing again with whatever number they chose. Once the hit “GRAPH” a circle should then come up. They then see how different polar graphs are from Cartesian graphs. Now, the graphs on a polar coordinate graph will all be circular instead of lines and curved lines like on the Cartesian graph.


Resources:

http://forecast.weather.gov/jetstream/doppler/how.htm

http://www.mi-net.ca/navigation.html

Engaging students: Deriving the Pythagorean theorem

In my capstone class for future secondary math teachers, I ask my students to come up with ideas for engaging their students with different topics in the secondary mathematics curriculum. In other words, the point of the assignment was not to devise a full-blown lesson plan on this topic. Instead, I asked my students to think about three different ways of getting their students interested in the topic in the first place.

I plan to share some of the best of these ideas on this blog (after asking my students’ permission, of course).

This student submission comes from my former student Delaina Bazaldua. Her topic, from Geometry: introducing proportions.

green line

How can technology (YouTube, Khan Academy [khanacademy.org], Vi Hart, Geometers Sketchpad, graphing calculators, etc.) be used to effectively engage students with this topic?

How has this topic appeared in the news?

Often students don’t realize how important math is in the “real world.” This video: https://www.youtube.com/watch?v=Qhm7-LEBznk is a funny and educational way for students to realize that math isn’t just for the classroom, but it can actually help you become famous if your spouse decides to post your lack of mathematical knowledge on YouTube (this video ended up turning into an interview on ABC News: https://www.youtube.com/watch?v=ordps6MbPhg)! The video is about a husband asking his wife how long it takes someone to get 80 miles if they were going 80 miles per hour. Since this topic is introducing proportions, I would push pause the video right after the question was asked (around 20 seconds into it) and ask the students to attempt the problem that the man is introducing with only their background knowledge of the concept from previous math classes. This is kind of a video of “what not to do” when solving proportions. After the video has concluded and the students get a good laugh, I would continue teaching the lesson and relate it back to the video since this is a real world question and is applicable to the topic. I think this is a good introduction to the lesson because it helps the students grasp the concept quickly and they will also find it humorous to watch.

green line

How could you as a teacher create an activity or project that involves your topic?

I found a really good blog from a teacher through Pinterest: http://mathequalslove.blogspot.com/2012/04/sugar-packets-and-proportions.html. This website is really great because it is posted from a teacher on a blog who actually tried the lesson. The lesson can be adjusted for a geometry class, but it is really remarkable the way it is without changing a thing especially as an introduction to proportions before going into deeper questions that involve geometry. Like the video above, it can be relatable by the audience of students because of how applicable it is to their life. Likewise, it could also help them eat/drink better! The goal of the lesson is to figure out how many packets of sugar are in a variety of food and drinks using proportions between packets of sugar and grams of sugar! The engage would include the video of someone eating packets of sugar, students brainstorming ideas of how many packets of sugar are in a drink, and then would escalate to students putting the drinks in order of most sugar to least sugar without looking at the nutritional label. After that, students would be given the fact that there are approximately 4 packets of sugar in a gram of sugar. They would also be given the nutritional labels to calculate how many packets are in the drinks using proportions. I think this is a good lesson because it engages the students by allowing them to relate to something that happens in everyday life when they drink/eat things. It is also a good way to introduce proportions with something concrete like bottles before introducing something that is somewhat abstract, such as shapes drawn on a paper which is how geometry is often seen.


green line

What interesting things can you say about the people who contributed to the discovery and/or the development of this topic?

Perhaps the most famous proportion in history is known as the “Divine Proportion.” Using the research found on the website: http://www.goldennumber.net/golden-ratio-history/, it can help students realize the history behind proportions because, despite popular belief, students need to learn the history of the concept they are being taught to fully grasp the concept of the topic. The website given is really great because it goes through the different names other than divine proportion, such as Golden Ratio and Fibonacci Sequence, and how it was discovered and rediscovered throughout time which is why there are so many unique names that exist now. I also found that the fact that the names that have the words ‘golden’ and ‘divine’ in the name are because of a spiritual background. Understanding divine proportion is important because it is around us every day and it is only a piece of the whole umbrella that engulfs all of probability. It is also applicable to students because it involves them and their physical body along with objects they interact with everyday. I found the topic of divine proportion very interesting and I would hope my students would as well which is why I think this is an extraordinary engage.

References:

https://www.youtube.com/watch?v=Qhm7-LEBznk

https://www.youtube.com/watch?v=ordps6MbPhg

http://mathequalslove.blogspot.com/2012/04/sugar-packets-and-proportions.html

http://www.goldennumber.net/golden-ratio-history


Engaging students: Verifying trigonometric identities

In my capstone class for future secondary math teachers, I ask my students to come up with ideas for engaging their students with different topics in the secondary mathematics curriculum. In other words, the point of the assignment was not to devise a full-blown lesson plan on this topic. Instead, I asked my students to think about three different ways of getting their students interested in the topic in the first place.

I plan to share some of the best of these ideas on this blog (after asking my students’ permission, of course).

This student submission comes from my former student Tracy Leeper. Her topic, from Precalculus: verifying trigonometric identities.

green line

Many students when first learning about trigonometric identities want to move terms across the equal sign, since that is what they have been taught to do since algebra, however, in proving a trigonometric identity only one side of the equality is worked at a time. Therefore my idea for an activity to help students is to have them look at the identities as a puzzle that needs to be solved. I would provide them with a basic mat divided into two columns with an equal sign printed between the columns, and give them trig identities written out in a variety of forms, such as \sin^2 \theta + \cos^2 \theta on one strip, and 1 written on another strip. Other examples would also include having \tan^2 \theta on one, and \sin^2 \theta/\cos^2 \theta on another. The students will have to work within one column, and step by step, change one side to eventually reflect the term on the other side, and each strip has to be one possible representation of the same value. By providing the students with the equivalent strips, they will be able to construct the proof of the identity. I feel that giving them the strips will allow them to see different possibilities for how to manipulate the expression, without leaving them feeling lost in the process, and by dividing the mat into columns, they can focus on one side, and see that the equivalency is maintained throughout the proof. The students would need to arrange the strips into the correct order to prove the left hand side is equivalent to the right hand side, while reinforcing the process of not moving anything across the equal sign.


green line

Trigonometry identities are used in most of the math courses after pre-calculus, as well as the idea of proving an equivalency. If the students learn the concept of proving an equivalency that will help them construct proofs for any future math courses, as well as learning to look at something given, and be able to see it as parts of a whole, or just be able to write it a different way to assist with the calculations. If students learn to see that

1 = \sin^2 x + \cos^2 x = \sec^2 x - \tan^2 x = \csc^2 x - \cot^2 x,

their ability to manipulate expressions will dramatically improve, and their confidence in their ability will increase, as well as their understanding of the complexities and relations throughout all of mathematics. The trigonometric identities are the fundamental part of the relationships between the trig functions. These are used in science as well, anytime a concept is taught about a wave pattern. Sound waves, light waves, every kind of wave discussed in science are sinusoidal wave. Anytime motion is calculated, trigonometry is brought into the calculations. All students who wish to progress in the study of science or math need to learn basic trigonometric identities and learn how to prove equivalency for the identities. Since proving trigonometric identities is also a practice in logical reasoning, it will also help students learn to think critically, and learn to defend their conjectures, which is a valuable skill no matter what discipline the student pursues.


green line

For learning how to verify trigonometric identities, I like the Professor Rob Bob (Mr. Tarroy’s) videos found on youtube. He’s very energetic, and very thorough in explaining what needs to be done for each identity. He also gives examples for all of the different types of identities that are used. He is very specific about using the proper terms, and he makes sure to point out multiple times that this is an identity, not an equation, so terms cannot be transferred across the equal sign. He also presents options to use for a variety of cases, and that sometimes things don’t work out, but it’s okay, because you can just erase it and start again. I also like that he uses different colored chalk to show the changes that are being made. He is very articulate, and explains things very well, and makes sure to point out that he is providing examples, but it’s important to remember that there are many different ways to prove the identity presented. I enjoyed watching him teach, and I think the students would enjoy his energy as well.


Engaging students: Finding the equation of a circle

In my capstone class for future secondary math teachers, I ask my students to come up with ideas for engaging their students with different topics in the secondary mathematics curriculum. In other words, the point of the assignment was not to devise a full-blown lesson plan on this topic. Instead, I asked my students to think about three different ways of getting their students interested in the topic in the first place.

I plan to share some of the best of these ideas on this blog (after asking my students’ permission, of course).

This student submission comes from my former student Tiffany Wilhoit. Her topic, from Precalculus: finding the equation of a circle.

green line

How has this topic appeared in pop culture (movies, TV, current music, video games, etc.)? How has this topic appeared in high culture (art, classical music, theatre, etc.)?

Circles are found everywhere! Everyday, multiple times a day, people come across circles. They are found throughout society. The coins students use to buy sodas are circles. On the news, we hear about crop circles and circular patterns in the fields around the world. One of the first examples of a circle was the wheel. Many logos for large companies involve circles, such as Coca-Cola, Google Chrome, and Target. Even the Roman Coliseum is circular in shape. Since circles are found everywhere, students will be able to identify and be comfortable with the shape (more than say a hexagon). A great way to get the students engaged in the topic of circles would be to have the brainstorm different places they see circles on a normal day. Then have each student pick an example and print or bring a picture of it. Then have the student take their circle (say the Ferris Wheel of the state fair), and place in centered at the origin. The students could then find the equation of their circle. They could do another example where their circle is centered at another point as well. This would allow the students to become more aware of circles around them, and would also allow them some freedom in the assignment.


green line

What interesting things can you say about the people who contributed to the discovery and/or the development of this topic?


Circles have been an interesting topic for humans since the beginning. We see the sun as a circle in the sky. The ancient Greeks even believed the circle was the perfect shape. Ancient civilizations built stone circles such as Stonehenge, and circular structures such as the Coliseum. The circle led to the invention of the wheel and gears, as well. The study of geometry is focused largely around the study of circles. The study of circles led to many inventions and ideas. Euclid studied circles, and compared them to other polygons. He found ways to create circles that could circumscribe and inscribe polygons. This created a problem called “squaring a circle”. Ancient Greeks tried to construct a circle and square with the same area using only a compass and straightedge. The problem was never solved, but in 1882 it was proved impossible. However, people still tried to solve the problem and were called “circle squarers”. This became an insult for people who attempted the impossible. Borromean Rings is another puzzle involving circles. Circles have been a part of civilization from the beginning, and it is amazing how much they are still prevalent today.

green line

How can technology (YouTube, Khan Academy [khanacademy.org], Vi Hart, Geometers Sketchpad, graphing calculators, etc.) be used to effectively engage students with this topic?


The website on www.mathopenref.com/coordgeneralcircle.html is a good site to use when learning to find the equation of a circle. The page contains an applet where the students are able to work with a circle. The circle can be moved so the center is at any point, and the radius can be changed to various sizes. At the top, it shows the equation of the circle shown. This website would allow the students to see how the equation of a circle changes depending on the center and size. This is a good tool to use for the students to explore circles and their equations or to review them before the test. The website also contains some information for the students to read to understand the concept, and there is even an example to try. The website is easy to use, and would not be difficult for students to understand.


Resources:

http://www-history.mcs.st-and.ac.uk/Curves/Circle.html

http://nrich.maths.org/2561

www.mathopenref.com/coordgeneralcircle.html

https://circlesonly.wordpress.com/category/history-of-circles/


Engaging students: Introducing the number e

In my capstone class for future secondary math teachers, I ask my students to come up with ideas for engaging their students with different topics in the secondary mathematics curriculum. In other words, the point of the assignment was not to devise a full-blown lesson plan on this topic. Instead, I asked my students to think about three different ways of getting their students interested in the topic in the first place.

I plan to share some of the best of these ideas on this blog (after asking my students’ permission, of course).

This student submission comes from my former student Nada Al-Ghussain. Her topic, from Precalculus: introducing the number e.

green line

How can this topic be used in your students’ future courses in mathematics or science?


Not every student loves math, but almost all students use math in his or her advanced courses. Students in microbiology will use the number e, to calculate the number of bacteria that will grow on a plate during a specific time. Biology or pharmacology students hoping to go into the health field will be able to find the time it takes a drug to lose one-half of its pharmacologic activity. By knowing this they will be able to know when a drug expires. Students going into business and finance will take math classes that rely greatly on the number e. It will help them understand and be able to calculate continuous compound interest when needed. Students who do love the math will get to explore the relation of logarithms and exponentials and how they interrelate. As students move into calculus, they are introduced to derivatives and integrals. The number e is unique, since when the area of a region bounded by a hyperbola y= 1/x, the x-axis, and the vertical lines x=1 and x= e is 1. So a quick introduction to e in any level of studies, reminds the students that it is there to simplify our life!


green line

What interesting things can you say about the people who contributed to the discovery and/or the development of this topic?


In the late 16th century, a Scottish mathematician named John Napier was a great mind that introduced to the world decimal point and Napier’s bones, which simplified calculating large numbers. Napier by the early 17th century was finishing 20 years of developing logarithm theory and tables with base 1/e and constant 10^7. In doing this, multiplication computational time was cut tremendously in astronomy and navigation. Other mathematicians built on this to make lives easier (at least mathematically speaking!) and help develop the logarithmic system we use today.

Henry Briggs, an English mathematician saw the benefit of using base 10 instead of Napier’s base 1/e. Together Briggs and Napier revised the system to base 10, were Briggs published 30,000 natural numbers to 14 places [those from 1 to 20,000 and from 90,000 to 100,000]! Napier’s became known as the “natural logarithm” and Briggs as the “common logarithm”. This convinced Johann Kepler of the advantages of logarithms, which led him to discovery of the laws of planetary motions. Kepler’s reputation was instrumental in spreading the use of logarithms throughout Europe. Then no other than Isaac Newton used Kepler’s laws in discovering the law of gravity.

In the 18th century Swiss mathematician, Leonhard Euler, figured he would have less distraction after becoming blind. Euler’s interest in e stemmed from the need to calculate compounded interest on a sum of money. The limit for compounding interest is expressed by the constant e. So if you invest $1 at a rate of interest of 100% a year and in interest is compounded continually, then you will have $2.71828… at the end of the year. Euler helped show us many ways e can be used and in return published the constant e. It didn’t stop there but other mathematical symbols we use today like i, f(x), Σ, and the generalized acceptance of π are thanks to Euler.


green line

How can technology be used to effectively engage students with this topic?


Statistics and math used in the same sentence will make most students back hairs stand up! I would engage the students and ask them if they started a new job for one month only, would they rather get 1 million dollars or 1 penny doubled every day for a month? I would give the students a few minutes to contemplate the question, without using any calculators. Then I would take a toll of the number of the students’ choices for each one. I would show them a video regarding the question and idea of compound interest. Students will see how quickly a penny gets transformed into millions of dollars in a short time. Money and short time used in the same sentence will make students fully alert! I would then ask them another question, how many times do you need to fold a newspaper to get to the moon? As a class we would decide that the thickness is 0.001cm and the distance from the Earth to the moon would be given. I would give them some time to formulate a number and then take votes around the class, which should be correct. The video is then played which shows how high folding paper can go! This one helps them see the growth and compare it to the world around them. After the engaged, students are introduced to the number e and its roll in mathematics.


Money: watch until 2:35:

Paper:


References:


http://mathworld.wolfram.com/e.html

http://betterexplained.com/articles/demystifying-the-natural-logarithm-ln/

http://www.math.wichita.edu/history/men/euler.html

http://www.maa.org/publications/periodicals/convergence/john-napier-his-life-his-logs-and-his-bones-introduction

http://math.about.com/library/weekly/blbionapier.htm

http://www.purplemath.com/modules/expofcns5.htm

http://ualr.edu/lasmoller/efacts.html


Engaging students: Graphing an ellipse

In my capstone class for future secondary math teachers, I ask my students to come up with ideas for engaging their students with different topics in the secondary mathematics curriculum. In other words, the point of the assignment was not to devise a full-blown lesson plan on this topic. Instead, I asked my students to think about three different ways of getting their students interested in the topic in the first place.

I plan to share some of the best of these ideas on this blog (after asking my students’ permission, of course).

This student submission comes from my former student Kristin Ambrose. Her topic, from Precalculus: finding the foci of an ellipse.

green line

How can you as a teacher create an activity or project that involves your topic?


In order to help my students visualize what foci are and the role they play in ellipses, I could do an activity that involves my students constructing ellipses given the foci. This can be done with two thumbtacks, string (tied into a loop), paper, and a pencil. What you do is place a piece of paper on top of a cork board, then stick two thumbtacks into the board and put a loop of string around them. Then take a pencil and pull the string tight, so that it makes a triangle. Then draw an ellipse by moving the pencil around the two thumbtacks, while keeping the string pulled tight to make a triangle shape. The picture below depicts how the activity should work.

ellipse3

I would give my students time to change the distance between the thumbtacks and create other ellipses, so that they could see how the distance between the two thumbtacks affects the shape of the ellipse. In keeping with the style of ‘discovery’ based learning, only after my students had created a few different ellipses would I explain that the thumbtacks are actually the ‘foci’ of the ellipse. I think this activity would help my students have a better visual of what foci actually are and how they affect the shape of ellipses. It would also help my students to understand why the sum of the distance between each foci and any point on the ellipse is always constant. I believe this would be a good segue into discussing how to find the foci of an ellipse.


green line

How can this topic be used in your students’ future courses in mathematics and science?


Ellipses tend to come up in topics like Physics and Astronomy. Specifically in Astronomy, ellipses become important when learning about orbits. An orbiting satellite follows an elliptical shape around an object called the primary. The primary simply means the body being orbited and is typically located at one of the two foci of an ellipse. A good website that describes this phenomenon is http://www.braeunig.us/space/orbmech.htm. This website explains different types of orbits and how they relate to different conic sections, ellipses being one of them. In our solar system, the Earth orbits the sun, with the sun lying at one of the foci on the ellipse. In elliptical orbits, the center of mass is located at a focus of the ellipse, but since the sun contains most of the mass in our solar system, the center of mass is located almost at the sun; therefore the planets orbit the sun. Below is an illustration of this concept.

ellipse4


green line

How can technology be used to effectively engage students with this topic?


A really neat tool to use in mathematics is a computer application called GeoGebra. It is free to download and useful for a lot of mathematical topics. For the topic of foci and ellipses, I would have students create an ellipse in GeoGebra using the ellipse tool. Once the ellipse is created, students can grab the foci points and pull them around to change the shape of the ellipse. Students can also grab the point ‘C’ and move it around to change the shape of the ellipse. The nice thing about GeoGebra is that not only does it show the shapes and points on the graph it also states the coordinates of the points in the ‘Algebra’ section. As students are exploring the different ways they can change the shape of the ellipse, they can also see how the coordinates change. On my GeoGebra ellipse, I also added a point ‘D’ which is the center of the ellipse. I created this point by typing D = (A+B)/2 in the ‘input’ section. Once ‘D’ is created, as students move the foci around, the location of ‘D’ will change as well, so students can see how the center of the ellipse and the location of the foci are interconnected. I think this tool would be a great way to get started on the topic of how to find foci, and it helps students to visualize how the shape of the ellipse, the foci, and the center of the ellipse are all interconnected. Below are some pictures of different ellipses I created in GeoGebra.

ellipse5 ellipse6

Engaging students: Solving logarithmic equations

In my capstone class for future secondary math teachers, I ask my students to come up with ideas for engaging their students with different topics in the secondary mathematics curriculum. In other words, the point of the assignment was not to devise a full-blown lesson plan on this topic. Instead, I asked my students to think about three different ways of getting their students interested in the topic in the first place.

I plan to share some of the best of these ideas on this blog (after asking my students’ permission, of course).

This student submission again comes from my former student Kelley Nguyen. Her topic: how to engage Algebra II or Precalculus students when solving logarithmic equations.

green line

How could you as a teacher create an activity or project that involves your topic? (Flashcard/Match Game)


Because the rules behind logarithms can be mastered with practice, I believe an activity would help the students understand and master the concept. For an activity, I would create a matching game. It will include multiple cards that have logarithmic equations, as well as a match card with its solution or rewritten equation. For example:

logarithm1

The students would be in groups of 2-4 players. The deck of cards will be well-shuffled and laid out face down. Player 1 will turn over two cards and determine if they’re a match. If they’re a matching pair, the student will keep the two cards. If they are not, the player will turn the cards face down again and now it’s Player 2’s turn. If the Player 1 found a match, he/she will go again, following their first attempt. The other players should be observing and checking each other’s pairs to ensure that they are correct matches. They can also help each other in the process, i.e. coaching.


Another activity can also be done with logarithmic equation and solution cards. In this activity, there are 2-4 players in each group. Each player will receive five cards from the deck and the rest of the deck will be placed in the middle of the players in one stack and face down. The players are able to look at their cards and think of the solutions to them. Player 1 will turn the top card in the deck face up. If Player 1 has a matching card, he/she will take the card and start a stack of his/her matching pairs then draw a card from the deck. [Note: players will have five cards at all times.] If Player 1 does not have a match, each player will take a turn. If there is no match, Player 2 will then flip the second card and repeat the process. When all cards in the deck have been flipped over, turn the entire deck face down again and continue. The game will go on until all cards are match up. Whoever has the most matched pairs wins the game.


green line

How can this topic be used in your students’ future courses in mathematics or science?


Logarithms are used frequently in chemistry when learning about acidity. In particular, the following equation describes a derivation of pH as the measure of acidity, as well as estimating the pH of a buffer solution and finding pH at equilibrium in acid-base reactions.

 pH = pK_\alpha + \log_{10} \left( \displaystyle \frac{ [A^-]}{[HA]} \right)

There is also a time when logarithms are used in physics when working with the Beer-Lambert Law. The intensity of a light Io passing through a length of size l of a solution of concentration c is given as follows:

 \log (I_0 ll) = \epsilon c l,

where \epsilon is the absorption coefficient.

Another way logarithms are utilized is in science courses when students are to make predictions on the spread of disease in the world. This issue is greatly seen as the population grows dramatically, and using a logarithmic approach will allow the student to make a reasonable guesstimate.


Because students are introduced to logarithms at the end of Algebra II, they will work with them a lot in pre-calculus, as well as into calculus when dealing with trigonometric equations where there is a variable in the base and in the exponent.


green line

How can technology be used to effectively engage students with this topic? (graphing calculator)


Although I think it’s easier to punch logarithmic equations into a calculator to get an answer, I still think that the students should conceptually learn why we come up with the answer. So, before allowing students to use calculators, make sure they know how we came up with the solutions. Once the students have mastered that concept, let them explore with their graphing calculators.

First, have the students put in the basic log function in Y1, then give them a log function with a transformation, whether it be a vertical shift, horizontal shift, or expansion, and store it into Y2. Ask the students to describe what they see.

Another way to utilize calculators with this topic is showing that the properties of logs are true, such as the addition rules of logarithmic equations being the log of the product of the arguments. You can also show the students how to change the base of a logarithmic equation on their calculators, since the standard log key is programmed at log10. That can be found when you click MATH and choice A in the first drop-down list.


References