Engaging students: Using the point-slope equation of a line

In my capstone class for future secondary math teachers, I ask my students to come up with ideas for engaging their students with different topics in the secondary mathematics curriculum. In other words, the point of the assignment was not to devise a full-blown lesson plan on this topic. Instead, I asked my students to think about three different ways of getting their students interested in the topic in the first place.

I plan to share some of the best of these ideas on this blog (after asking my students’ permission, of course).

This student submission again comes from my former student Rachel Delflache. Her topic, from Algebra: using the point-slope equation of a line.

green line


A2: How could you as a teacher create an activity that involves the topic?

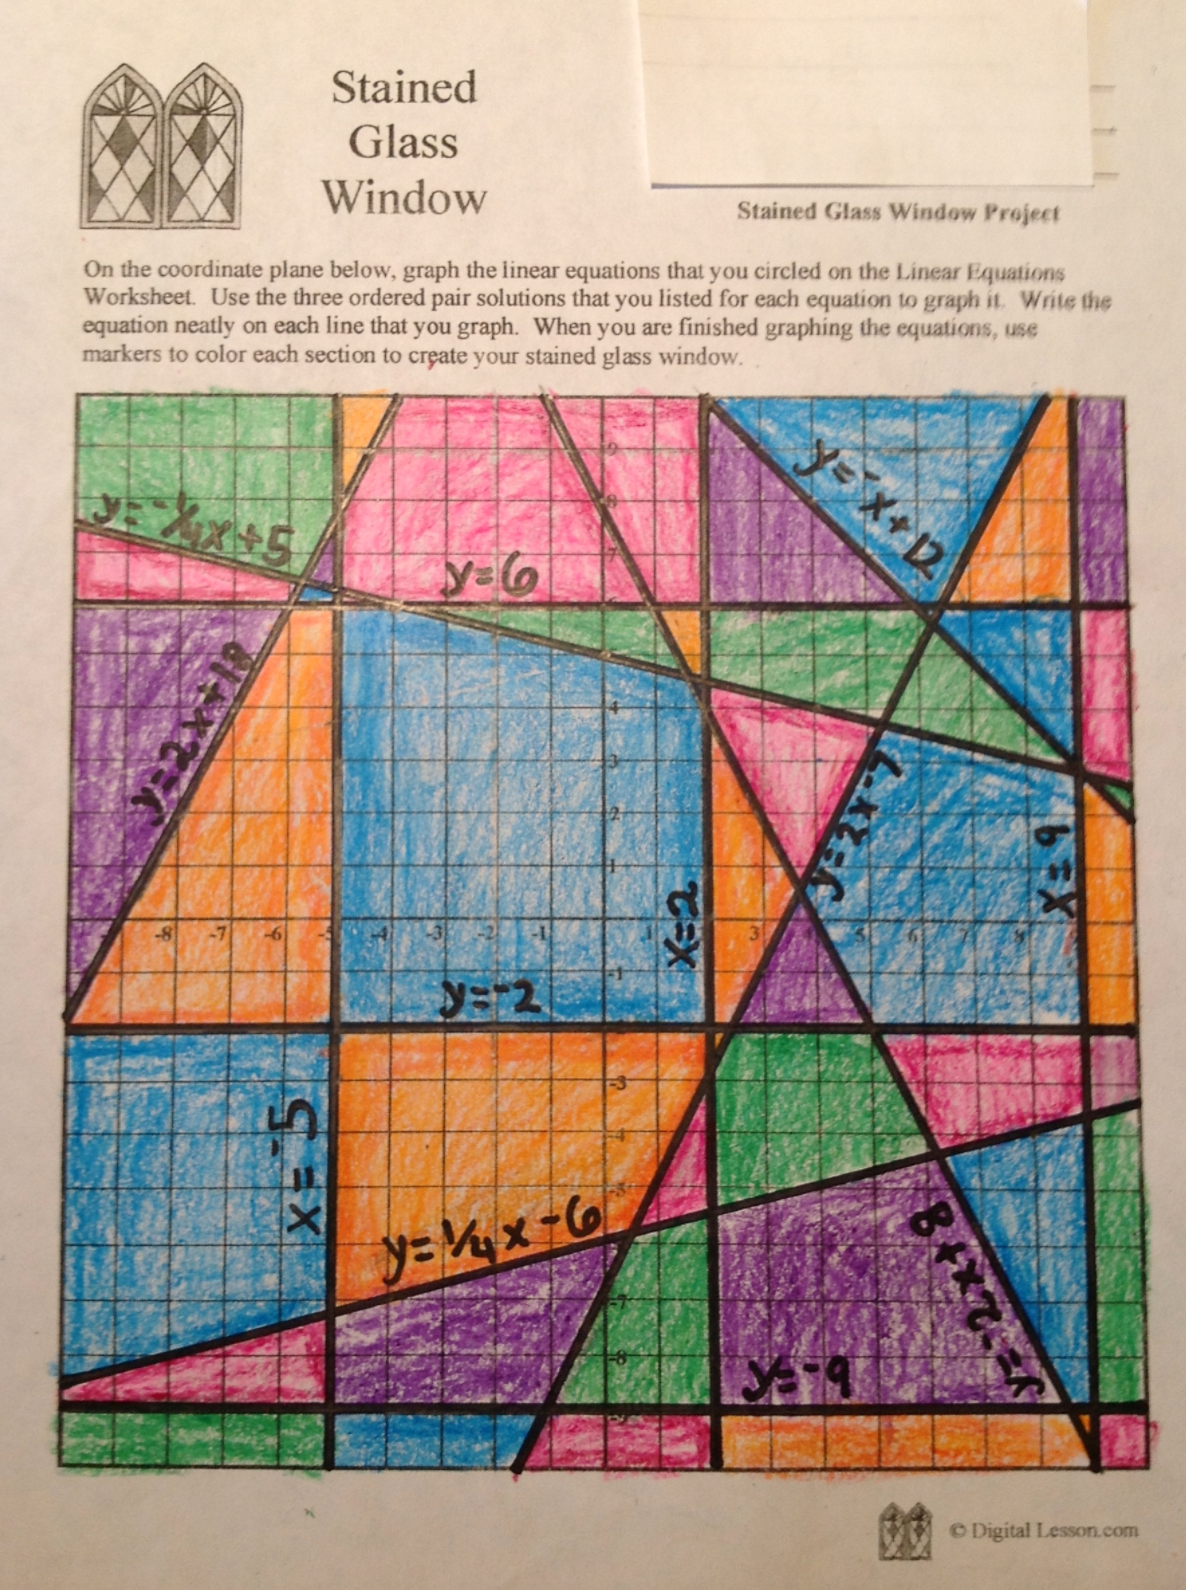
An adaptation of the stained-glass window project could be used to practice the point-slope formula (picture beside). Start by giving the students a piece of graph paper that is shaped like a traditional stained-glass window and then let they students create a window of their choosing using straight lines only. Once they are done creating their window, ask them to solve for and label the equations of the lines used in their design. While this project involves the point slope formula in a rather obvious way, giving the students the freedom to create a stained-glass window that they like helps to engage the students more than a normal worksheet. Also, by having them solve for the equations of the lines they created it is very probable that the numbers they must use for the equation will not be “pretty numbers” which would add an addition level of difficulty to the assignment.

green line

B2: How does this topic extend what your students should have learned in previous courses?

The point-slope formula extends from the students’ knowledge of the slope formula

m = (y2-y1)/(x2-x1)
(x2-x1)m = y2-y1
y-y1 = m(x-x1).

This means that the students could solve for the point-slope formula given the proper information and prompts. By allowing students to solve for the point-slope formula given the previous knowledge of the formula for slope, it gives the students a deeper understanding of how and why the point-slope formula works the way it does. Allowing the students to solve for the point-slope formula also increases the retention rate among the students.


green line

C1&3: How has this topic appeared in pop culture and the news?

Graphs are everywhere in the news, like the first graph below. While they are often time line charts, each section of the line has its own equation that could be solved for given the information found on the graph. One of the simplest way to solve for each section of the line graph would be to use point slope formula. The benefit of using point slope formula to solve for the equations of these graphs is that there is very minimal information needed—assuming that two coordinates can be located on the graph, the linear equation can be solved for. Another place where graphs appear is in pop culture. It is becoming more common to find graphs like the second one below. These graphs are often time linear equation for which the formula could be solved for using the point slope formula. These kinds of graphs could be used to create an activity where the students use the point slope formula to solve to the equations shown in either the real world or comical graph.


References:

Stained glass window-

Stained Glass Window Graphing Project

iPhone sales-
https://www.usatoday.com/story/tech/news/2017/06/28/iphones-smartphone-revolution-4-graphs/103216746/

Halloween graph-
https://www.buzzfeed.com/agh/halloween-charts-and-graphs?utm_term=.hpXrNWPm9#.qpvwGmxp0


Engaging students: Finding x- and y-intercepts

In my capstone class for future secondary math teachers, I ask my students to come up with ideas for engaging their students with different topics in the secondary mathematics curriculum. In other words, the point of the assignment was not to devise a full-blown lesson plan on this topic. Instead, I asked my students to think about three different ways of getting their students interested in the topic in the first place.

I plan to share some of the best of these ideas on this blog (after asking my students’ permission, of course).

This student submission again comes from my former student Deetria Bowser. Her topic, from Algebra: finding x- and y-intercepts. Unlike most student submissions, Maranda’s idea answers three different questions at once.

green line


E1. How can technology (YouTube, Khan Academy [khanacademy.org], Vi Hart, Geometers Sketchpad, graphing calculators, etc.) be used to effectively engage students with this topic? Note: It’s not enough to say “such-and-such is a great website”; you need to explain in some detail why it’s a great website.

One example of an engaging form of technology that involves finding x- and y-intercepts of lines is mangahigh.com. Under the algebra section, there is a tab for finding x and y intercepts which once clicked provides an option to start a game (“Algebra.”). In this game, the student is expected to look at lines and quickly decipher what is known about the x and y intercepts of the line in question. Before the game begins, the student is able to choose the difficulty of the game as well as the number of questions. After the game is completed students are able to review their answers. Implementing this website into the classroom will help students gain quickness in identifying x and y intercepts. Additionally, this game is also a quick and fun way to evaluate students understanding of x and y intercepts, without forcing them to take a quiz.

green lineD1. What interesting things can you say about the people who contributed to the discovery and/or the development of this topic? (You might want to consult Math Through The Ages.)

The topic of x and y intercepts falls under a much broader topic called analytical geometry.The article “Analytic geometry” defines analytical geometry as “[a] mathematical subject in which algebraic symbolism and methods are used to represent and solve problems in geometry” (D’Souza). One of the people who discovered this topic was René Descartes. René Descartes was actually a french modern philosopher who also made discoveries in the realms of science as well as mathematics. Descartes “dismissed apparent knowledge derived from authority,” meaning that he made his discoveries based on what he thought rather than taking ideas from scientists, philosophers and mathematicians (Watson). He discovered analytical mathematics (along with Fermat) in the 1630s (D’Souza). He also “he stressed the need to consider general algebraic curves—graphs of polynomial equations in x and y of all degrees” (D’Souza). Mentioning Descartes in class, and explaining his accomplishments in Mathematics as well as modern philosophy and science, will encourage students to realize that they can succeed in more than one subject . Also, Descartes can be used as an influence in the building of ideas in the classroom, since he did not just accept ideas already created.

green line

C1. How has this topic appeared in pop culture (movies, TV, current music, video games, etc.)?

The topic of x and y intercepts appeared on a “pop culture blog” called the comeback.com. In an article posted in November 2016, a former UCLA and current Cleveland Indians baseball player named Trevor Bauer helped one of his fans with her math homework (Blazer). This article describes a girl asking Bauer for help determining the slope of a line and the y – intercepts via Twitter. Her specific question involves the equation 2y=x (Blazer). He then explains that “for every 1 unit on the x axis go 2 units on the y axis. y intercept is where it crosses the y axis. Make y 0 and figure x” (Blazer). Since Bauer is a professional baseball player, he already has a great influence over people. Showing students this article about Bauer will show students that even people who play baseball for a living still have the knowledge of Algebra.


References
“Algebra.” Mangahigh.com – Algebra,
http://www.mangahigh.com/en-us/math_games/algebra/straight_line_graphs/find_the_x_and_y_intercepts_of_lines. Accessed 15 Sept. 2017.

Blazer, Sam, et al. “Trevor Bauer helped a fan do their math homework on Twitter.” The
Comeback, 13 Nov. 2016,
thecomeback.com/mlb/trevor-bauer-twitter-math-homework.html. Accessed 15 Sept.
2017.

D’Souza, Harry Joseph, and Robert Alan Bix. “Analytic geometry.” Encyclopædia Britannica,
Encyclopædia Britannica, inc., 6 June 2016,
http://www.britannica.com/topic/analytic-geometry. Accessed 15 Sept. 2017.

Watson, Richard A. “René Descartes.” Encyclopædia Britannica, Encyclopædia Britannica, inc.,
27 Jan. 2017, http://www.britannica.com/biography/Rene-Descartes. Accessed 15 Sept. 2017.

Engaging students: Finding the slope of a line

In my capstone class for future secondary math teachers, I ask my students to come up with ideas for engaging their students with different topics in the secondary mathematics curriculum. In other words, the point of the assignment was not to devise a full-blown lesson plan on this topic. Instead, I asked my students to think about three different ways of getting their students interested in the topic in the first place.

I plan to share some of the best of these ideas on this blog (after asking my students’ permission, of course).

This student submission again comes from my former student Deanna Cravens. Her topic, from Algebra: finding the slope of a line.

green lineC3. How has this topic appeared in high culture (art/sports)?

While one might not think of ski jumping as an art but more of a sport, there is definitely an artistic way about doing the jumping. The winter Olympics is one of the most popular sporting events, besides the summer Olympics that the world watches. This is a perfect engage for the beginning of class, not only is it extremely humorous but it is extremely engaging. It will instantly get a class interested in the topic of the day. I would first ask the students what the hill the skiers going down is called. Of course the answer that I would be looking for is the “ski slope.” This draws on prior knowledge to help students make a meaningful connection to the mathematical term of slope. Then I would ask students to interpret the meaning of slope in the context of the skiers. This allows for an easy transition into the topic for finding the slope of a line.


green line

C1. How has this topic appeared in pop culture (movies, TV, current music, video games, etc.)?

Look at this scene from Transformers, it shows a perfect example of a linear line on the edge of the pyramid that the Decepticon is destroying. This video easily catches the attention of students because it is from the very popular Transformer movie. I would play the short twenty second clip and then have some student discussion at the beginning of class. This could be done as an introduction to the topic where students could be asked “how can we find the steepness of that edge of the pyrmaid?” Then the students can discuss with a partner and then group discussion can ensue. It could also be done as a quick review, where students are asked to recall how to find the slope of a line and what it determines. The students would be asked to draw on their knowledge of slope and produce a formula that would calculate it.


green line

How can this topic be used in your students’ future courses in mathematics or science?
Finding the slope of a line is an essential part of mathematics. It is used in statistics, algebra, calculus, and so much more. One could say it is an integral part of calculus (pun intended). Not only is it used in mathematics classes, but it is also very relevant to science. One specific example is chemistry. There are specific reaction rates of solutions. These rates are expressed in terms of change in concentration divided by the change in time. This is exactly the formula that is used in math classes to find the slope. However, it is usually expressed in terms of change in y divided by change in x. Slope is also used in physics when working with velocity and acceleration of objects. While one could think of slope in the standard way of ‘rise over run,’ in these advanced classes whether math or science, it usually better thought of as ∆y/∆x.

References:


Engaging students: Solving linear systems of equations with matrices

In my capstone class for future secondary math teachers, I ask my students to come up with ideas for engaging their students with different topics in the secondary mathematics curriculum. In other words, the point of the assignment was not to devise a full-blown lesson plan on this topic. Instead, I asked my students to think about three different ways of getting their students interested in the topic in the first place.

I plan to share some of the best of these ideas on this blog (after asking my students’ permission, of course).

This student submission comes from my former student Danielle Pope. Her topic, from Algebra II: solving linear systems of equations with matrices.

green line

B2. How does this topic extend what your students should have learned in previous courses?

Based off of the TEKS, matrices are introduced in Algebra 2. In previous math courses, students are already going to learn basic arithmetic from elementary school and solving equations in middle and high school. By the time students get to high school, they should have solving single equations down. This concept is then expanded with a system of equations, which is taught with the help of matrices. A matrix is just an “array of numbers” so that’s why this method of solving can be used with linear equations. Once the matrix is set up there are 2 main ways to solve for the solutions. The one I will be discussing is reduced row echelon form. This method of solving systems utilizes the basic arithmetic that students already know. There are 3 row operations that students already know how to use in general not related to matrices. Those are multiplying a row by a constant, switching two rows, and adding a constant times a row to another row. Even though these specific operations are used for matrices, kids have seen how to multiply 2 constants or variables, switching variables, and adding constants or variables in their previous courses. Matrices just add another element to their basic arithmetic abilities.


green line

D4. What are the contributions of various cultures to this topic?

Matrices have been around for much longer than some people may realize. One of the earliest civilizations that matrices were traced back to were the Babylonians. This was just one of the many contributions that they contributed to mathematics. The Chinese wrote a book, Nine Chapters of the Mathematical Art, Written during the Han Dynasty in China gave the first known example of matrix methods”. During the same era, around 200 BC, a Chinese mathematician Liu Hui solved linear equations using matrices. In the 1800s, Germany started taking a look at matrices. German mathematician, Carl Jacobi, brought the idea of determinants and matrices into the light. Carl Gauss, another German mathematician, took this idea of determinants and developed it. It wasn’t until Augustin Cauchy, a French mathematician, used and defined the word determinant how was use it today. James Sylvester, an English mathematician, “used the term matrix in 1850”. Sylvester also worked with mathematician Arthur Cayley who “first published an abstract definition of matrix” in his memoir on the Theory of Matrices in 1858. This final definition of a determinant is still used today in classrooms to help solve complex system of equations.


green lineE1. How can technology (YouTube, Khan Academy [khanacademy.org], Vi Hart, Geometers Sketchpad, graphing calculators, etc.) be used to effectively engage students with this topic?

In a classroom today, students should be able to access use of a graphing calculator. The matrix feature on these can easily check the work of students just learning how to row-reduce or solve for determinants and inverse matrices. In the classroom, I would use this technology like a race for the right answer to get them engaged in matrices. Give students an easy 2-equation system and have them solve for the variables. Each new problem add an equation or add a variable. While students are solving by hand, the teacher will be using the calculator to see which person can get the answer first. Overtime the problems will be too daunting to do by hand so students will be more engaged to learn this faster shortcut using the calculator. Another resource that can be used out of the classroom is Khan Academies’ videos on solving system of equations with matrices. These videos can be used to fill in any gaps if students have questions at home. These videos can also be used as the lecture in a flipped classroom environment.

References

https://www.mathsisfun.com/algebra/systems-linear-equations-matrices.html
http://www.sparknotes.com/math/algebra2/matrices/section4.rhtml
http://math.nie.edu.sg/bwjyeo/it/MathsOnline_AM/livemath/the/IT3AMMatricesHistory.html

http://math.nie.edu.sg/bwjyeo/it/MathsOnline_AM/livemath/the/IT3AMMatricesHistory.html
http://www.storyofmathematics.com/mathematicians.html

https://www.khanacademy.org/math/precalculus/precalc-matrices/solving-equations-with-inverse-matrices/v/matrix-equations-systems


Engaging students: Parallel and perpendicular lines

In my capstone class for future secondary math teachers, I ask my students to come up with ideas for engaging their students with different topics in the secondary mathematics curriculum. In other words, the point of the assignment was not to devise a full-blown lesson plan on this topic. Instead, I asked my students to think about three different ways of getting their students interested in the topic in the first place.

I plan to share some of the best of these ideas on this blog (after asking my students’ permission, of course).

This student submission again comes from my former student Cody Jacobs. His topic, from Algebra: parallel and perpendicular lines.

green line

D1. What interesting things can you say about the people who contributed to the discovery and/or the development of this topic?

Euclid is one of the most famous mathematicians of all time. His fame rests mostly on his 13 books commonly referred to as Euclid’s Elements. Euclid’s Elements are said to have a greater impact on the human mind that any other book except for the bible. Euclid contributed to the development of this topic based off the fact that his Elements have been used for centuries for teaching foundational geometry. The importance of Euclid’s books come from the minimal assumptions made, and the natural progression from simple results to more complex results. Euclid starts of listing 23 definitions and 5 postulates in which uses to prove theorems. His books contain over 400 theorems and proofs which layout the guidelines for how we use geometry today.

green line

E1. How can technology be used to effectively engage students with this topic?

Desmos.com is a great website website that allows you to pick out activities your students can do. They have some activities regarding parallel and perpendicular lines where students shift the lines to make them parallel or perpendicular. I have used this website before regarding parabolas and students are fully engaged. Desmos has plenty of activities to choose from to find the right fit for your class, so do not be afraid to look around for a while. You can sign in as a teacher and make a code for your students to get into the activity. There are even some word problems so you can get a better understanding of what your students are thinking. I think Desmos is best used at the end of a topic, more as a general review over everything because the activities go through topics pretty fast.

green line

B1. How can this topic be used in your students’ future courses in mathematics or science?

Students will continue to use parallel and perpendicular equations throughout their mathematical career. I am now in vector calculus and I am still using parallel and perpendicular lines in 3-dimensional planes. With that being said parallel and perpendicular lines are not going to disappear as you go further into math, in fact you have to start using different methods to find the parallel and perpendicular lines the farther you go. Soon it will no longer be as simple as duplicating the slope or finding the reciprocal. Parallel and perpendicular lines also play a key part in physics regarding vectors just as they do in vector calculus, when you try to find equilibrium forces.


Engaging students: Approximating data by a straight line

In my capstone class for future secondary math teachers, I ask my students to come up with ideas for engaging their students with different topics in the secondary mathematics curriculum. In other words, the point of the assignment was not to devise a full-blown lesson plan on this topic. Instead, I asked my students to think about three different ways of getting their students interested in the topic in the first place.

I plan to share some of the best of these ideas on this blog (after asking my students’ permission, of course).

This student submission again comes from my former student Caroline Wick. Her topic, from Algebra: approximating data to a straight line.

green lineB1. Curriculum

How can this topic be used in your students’ future courses in mathematics or science?

Though approximating data by a straight line is a subject that is brought up in Algebra 2, it is something that students will need to use in a number of subjects down the line. Probably the most obvious subject would be statistics. Finding an approximate trend line is extremely important for a statistician so that they can predict future, unobserved data. Another example that might not be as readily noticeable would be anthropology. Anthropology is the study of humans in various parts of life. In this case, according to Brian Hopkins, anthropology can be used by stores to figure out what types of products they should stock on their shelves during different types of the year. They do this by collecting the data, then approximating the trend lines to predict how the product will sell during the same season of the next year. For example, Orange Juice and tissues are known to be sold more often during the winter seasons, so stores know that they want to stock up on orange juice and tissue during the colder season each year.


green line


A1: Applications

What interesting (i.e., uncontrived) word problems using this topic can your students do now?
Using the data given below:
(a) plot the points on a graph
(b) Then, using a ruler, do your best to approximate a trend line that fits the points
(c) Write an equation (y=mx+b) that best fits the trend line
(d) Approximate the next four numbers on the line using the equation you created.

Population growth in squirrels in TX from 1950-1980 (in millions)*
Year (x) 1950 1955 1960 1965 1970 1975 1980
Pop. (y) 12 12.7 13.1 13 13.6 13.7 14

From here the student would create his/her graph with the plotted points, find a line that best fits the points with equal numbers over and under the line. They would then use the data and the line to find an equation that best fits the scatter plot data that they graphed. They would then find the approximate squirrel population for 1985, 1990, 1995, and 2000.

This could be either an assignment or it could turn into a project for students with different sets of data. Students could even collect their own data to formulate the graph and equation.

*not real data, fabricated for this problem specifically.

green line

Culture
How has this topic appeared in pop culture (movies, TV, current music, video games, etc.)?

The approximation of data through trend lines has been used in pop culture since the birth of popular culture in the mid twentieth century. More relevantly, it is used to map certain cultural trends. When a new movie is coming out, statisticians use previous data from people who watched/reviewed the movie before its release to map out how they believe it will be appreciated by the public. A movie that did will before its release will likely have a positive trend line that continues upward at a somewhat steady rate. It will get more tickets at the box office than a movie that was not as well liked that might have a less-steep slope. Statisticians use this same trend approximation with TV shows and whether they should run another season, or in music when it hits the top of the charts. The more people listen to a song, the more likelihood it has to be listened to other people, thus the trend continues upward until is slowly dies off.

Take for instance, Taylor Swift’s “Look What You Made Me Do” that was released August 25th of this year. From its release and popularity, statisticians were able to track the data and predict that the song would be number 1 on the top 100 just a few weeks after its release.

References:

B1: https://www.cio.com/article/2372429/enterprise-architecture/the-anthropology-of-data.html
C1: http://www.billboard.com/articles/news/7949029/taylor-swift-look-what-you-made-me-do-timeline-reputation


Engaging students: Factoring polynomials

In my capstone class for future secondary math teachers, I ask my students to come up with ideas for engaging their students with different topics in the secondary mathematics curriculum. In other words, the point of the assignment was not to devise a full-blown lesson plan on this topic. Instead, I asked my students to think about three different ways of getting their students interested in the topic in the first place.

I plan to share some of the best of these ideas on this blog (after asking my students’ permission, of course).

This student submission again comes from my former student Brittnee Lein. Her topic, from Algebra: factoring polynomials.

green line

1. How can technology be used to effectively engage students with this topic?

There are many great websites that can help to provide students a conceptual framework for factoring polynomials in lieu of simple lecture. This website lets students explore polynomial equations with online algebra tiles.

https://illuminations.nctm.org/activity.aspx?id=3482

Algebra tiles are effective in teaching factoring because they provide a visual representation of abstract concepts and allow students to understand that the symbol “=” in an equation really means equivalence (i.e. what you do to one side of the equation, you must do to the other side). I also think algebra tiles are very beneficial in teaching students about zero pairs. There are other websites –such as wolfram alpha– that are especially great supplements to go alongside topics such as factoring polynomials because students can see the graphical meaning of the roots of a quadratic equation. When combined, these websites can aid students in gaining a both conceptual and procedural understanding of the topic.


green line

How could you as a teacher create an activity or project that involves your topic?

There is an activity called “Factor Draft” where students set up a ‘playing field’ of cards. In this field, there are factor cards such as (x+2), (x-12), etc. sum (5x), (12x), etc., and product cards (1), (42), and so on. The goal of the game is to draw a winning hand of two factor cards and a corresponding sum and product card. Each card is color coded to their type. Each turn a player draws one card from the field of face up cards. The player must pay mind to not only his/her own cards but also those of their opponent’s –as the first person to get two factor cards and their corresponding sum and product card wins. This activity is beneficial in furthering student understanding between the relationships between each term in a quadratic polynomial. For example (x+4)(x-3) = x^2 + 1x - 12 and the corresponding factor cards would be (x+4) and (x-3) the sum card would be (1x) and the product card would be (-12). This activity allows students to intuitively get a sense of the process of factoring and gives them practice multiplying out polynomials.


green line

2. How can this topic be used in your students’ future courses in mathematics or science?
• Factoring polynomials is used in many important future science and mathematics concepts. When a quadratic equation cannot be factored simply, teachers must introduce the quadratic formula. This slides into the introduction of complex roots of an equation and complex numbers. When factoring polynomials of higher degree than 2, synthetic division (another topic in high school mathematics) is useful in finding the roots of the equation. If a student is able to understand the meaning of the roots of an equation, that will aid in solving many interesting physics and mathematics problems. Factoring is used quite often to find the domain of a rational equation such as f(x) = (x+2)/ (x^2+ 4x+3). A student must also have a strong basis in factoring polynomials to learn concepts such as completing the square.

References

• National Library of Virtual Manipulatives, nlvm.usu.edu/en/nav/vlibrary.html.

• Cleveland, James. “The Factor Draft.” The Roots of the Equation, 23 May 2014, rootsoftheequation.wordpress.com/2014/05/22/the-factor-draft/.

Engaging students: Graphing Square Root Functions

In my capstone class for future secondary math teachers, I ask my students to come up with ideas for engaging their students with different topics in the secondary mathematics curriculum. In other words, the point of the assignment was not to devise a full-blown lesson plan on this topic. Instead, I asked my students to think about three different ways of getting their students interested in the topic in the first place.

I plan to share some of the best of these ideas on this blog (after asking my students’ permission, of course).

This student submission again comes from my student Alexandria Johnson. Her topic, from Algebra II: graphing square root functions.

green line

An interesting word problem that students should be able to solve after completing a lesson on graphing square root functions would be: “The Chandra satellite detected x-rays coming from the region of the sky containing the galaxy cluster JKS041. The electrons in the gas are emitting the X-rays, and colliding at high speed with the protons in the gas. The energy of the x-rays at the time they were emitted by the hot gas was 21,400 electron Volts (eV). This energy is shared equally between the electrons and protons. The speed of a proton is related to its kinetic energy by E = 1/2mV^2 where E is the energy in Joules, V is the proton speed in meters/sec, and m is the mass of a proton (m = 1.7 x 10⁻²⁷ kg). About how fast are the protons moving? (Note: 1 eV = 1.6 x 10^-19 Joules)”. Students can arrange the problem into a square root function to solve for velocity: V=sqrt(2E/m). Using the information provided students can convert eV to E and solve for m. Once this information is found, students can plug in the numbers to solve for V. Note: this question is difficult and some students may struggle with the calculations. A simpler question about the relationship between kinetic energy and velocity could be used in place of this one. Question provided by https://spacemath.gsfc.nasa.gov/weekly/6Page70.pdf.


green line

In Physics, students will be able to use square root functions to describe the relationship between different variables. Having the knowledge of graphing square root functions will allow students to represent these relationships graphically. For example, to find kinetic energy, students use the formula E=(1/2)*m*v^2, where m=mass and v=velocity. Students can manipulate the equation to find v which would be v=sqrt(2E/m). Given m, students should be able to graph the relationship between v and E. When solving for volume, students can rearrange the equation into the form y=a*sqrt(x-h)+k, where h=0, k=0 y=v, x=E, and a=sqrt(2/m). knowing how to graph a square root function, students can graph this equation.

green line

A useful resource when creating a lesson about graphing square root functions is https://teacher.desmos.com/. This website provides teachers with existing activities that the students can complete. Also, it allows the teacher to create activities for the student. An activity that is already created for teacher use is called Polygraph: Square root functions. In this activity, students play a game similar to the board game Guess Who. Students pair up and are given a set of graphs of square root functions. Partner 1 chooses a graph. Then, Partner 2 asks questions about the graphs to try to find the graph that Partner 1 chose. Students compare various graphs and communicate these differences. Though the website doesn’t offer any other premade activities at this time, teachers can use the activity type “marble slides” to create an activity that shows how a, h and k affect the parent function of square roots. green line
Work cited

“Chandra Spies the Most Distant Cluster in the Universe.” Space Math, NASA, Chandra Spies the Most Distant Cluster in the Universe. Accessed 15 Sept. 2017.
“Square Root Functions.” Desmos Classroom Activities, teacher.desmos.com/polygraph/custom/560ad29158fd074d156300b6. Accessed 15 Sept. 2017