Hat tip to http://www.thisiscolossal.com/2013/06/the-visual-patterns-of-audio-frequencies-seen-through-vibrating-sand/, where I first saw the video below and which posts some details about how this video was made.
Category: Engagement
Cryptography As a Teaching Tool
From the webpage Cryptography As a Teaching Tool, found at http://www.math.washington.edu/~koblitz/crlogia.html, which was written by Dr. Neal Koblitz, Professor of Mathematics at the University of Washington:
Cryptography has a tremendous potential to enrich math education. In the first place, it puts mathematics in a dramatic setting. Children are fascinated by intrigue and adventure. More is at stake than a grade on a test: if you make a mistake, your agent will be betrayed.
In the second place, cryptography provides a natural way to get students to discover certain key mathematical concepts and techniques on their own. Too often math teachers present everything on a silver platter, thereby depriving the children of the joy of discovery. In contrast, if after many hours the youngsters finally develop a method to break a cryptosystem, then they will be more likely to appreciate the power and beauty of the mathematics that they have uncovered. Later I shall describe cryptosystems that the children can break if they rediscover such fundamental techniques of classical mathematics as the Euclidean algorithm and Gaussian elimination.
In the third place, a central theme in cryptography is what we do not know or cannot do. The security of a cryptosystem often rests on our inability to efficiently solve a problem in algebra, number theory, or combinatorics. Thus, cryptography provides a way to counterbalance the impression that students often have that with the right formula and a good computer any math problem can be quickly solved.
Mathematics is usually taught as if it were a closed book. Other areas of science are associated in children’s minds with excitement and mystery. Why did the dinosaurs die out? How big is the Universe? M. R. Fellows has observed that in mathematics as well, the frontiers of knowledge can and should be put within reach of young students.
Finally, cryptography provides an excellent opportunity for interdisciplinary projects… in the middle or even primary grades.
This webpage provides an excellent mathematical overview as well as some details about to engage students with the mathematics of cryptography.
Math T-shirts
The following are the three finalists for the T-shirt contest sponsored by the Mathematical Association of America.


 Source: https://www.facebook.com/media/set/?set=a.10151715596230419.1073741825.153302905418&type=1
Engaging students: Box and whisker plots
In my capstone class for future secondary math teachers, I ask my students to come up with ideas for engaging their students with different topics in the secondary mathematics curriculum. In other words, the point of the assignment was not to devise a full-blown lesson plan on this topic. Instead, I asked my students to think about three different ways of getting their students interested in the topic in the first place.
I plan to share some of the best of these ideas on this blog (after asking my students’ permission, of course).
This submission comes from my former student Jesse Faltys. Her topic: how to engage students when teaching box and whisker plots.
A. Applications – How could you as a teacher create an activity or project that involves your topic?
Students can take a roster of a professional basketball team and create a box and whiskers plot by using the players’ stats of height and weight. As the teacher, you can provide these numbers to them. The weight should be left in pounds, but change the height measurement to inches. The students could be placed in groups of 3 or 4 and given different team rosters. First, have the student calculate the minimum, maximum, lower quartile, upper quartile, and median for their roster for both the weight and height. Then, have the students place the plots on large sheets of paper and present to the class. As the students compare their plots, they can begin to see what effects the range of data has on the construction of each box and whisker plot. Depending on the knowledge of the students you might want them to all working on the same team. As the teacher, you can remove one player’s stats from each group effectively changing the box and whiskers plots and having the students analyzing the data’s effect on the plot constructed from the same roster.
I actually used this in a lesson during my Step II class in a middle school classroom. I used information from the Illuminations website at http://illuminations.nctm.org/LessonDetail.aspx?ID=L737.
B. Curriculum – How can this topic be used in your students’ future courses in mathematics or science?
Any science course with a lab will require you to complete a formal lab write-up. The data collected from your experiment will need to be represented in an organized manner. The features of a box-and-whiskers plot will allow you to gather all your information and make observations off the data that your group and the class as a whole collected. This information can be combined into one plot or the individual lab groups can be compared for any inconsistencies. A box-and-whisker plot can be useful for handling many data values. It shows only certain statistics rather than all the data. Five-number summary is another name for the visual representations of the box-and-whisker plot. The five-number summary consists of the median, the quartiles, and the smallest and greatest values in the distribution. Immediate visuals of a box-and-whisker plot are the center, the spread, and the overall range of distribution. This documentation will allow the student to make a formal analysis while putting together their formal lab write-up.
E. Technology – How can technology be used to effectively engage students with this topic?
1. Khan Academy provides a video titled “Reading Box-and-Whisker Plots” which shows an example of a collection of data on the age of trees. The instructor on the video goes through the representations of the different parts of the structure of the box and whiskers plot. For our listening learners, this reiterates to the student what the plot is summarizing. http://www.khanacademy.org/math/probability/descriptive-statistics/Box-and-whisker%20plots/v/reading-box-and-whisker-plots
2. Math Warehouse allows you to enter the data you are using and it will calculate the plot for you. After having the students work on their own plots, you can have them check their work for themselves. This will allow for immediate confirmation if the student is creating the graph correctly with the data provided. Also, this is allowing the visual learners to see what happens to the length of the box or whiskers when changes are made to the minimum, maximum or median. http://www.mathwarehouse.com/charts/box-and-whisker-plot-maker.php#boxwhiskergraph
3. The Brainingcamp is another website that allows for interaction between the different parts of the plot and the student. This website allows for the students to see a group of data and the matching box-and-whiskers plot. The student can then explore by manually changing different values and instantly seeing a change in the graph. This involvement can stimulate questions to direct the student to complete understanding of the subject. As a hands on learner, it allows the students to manipulate the plot immediately in different “what if” situations. http://www.brainingcamp.com/resources/math/box-plots/interactive.php
Binary sudoku
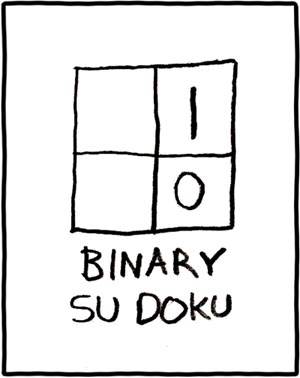
After a week of posts on Taylor series, I thought something on the lighter side would be appropriate.
Source: http://www.xkcd.com/74/
Engaging students: Solving one-step and two-step inequalities
In my capstone class for future secondary math teachers, I ask my students to come up with ideas for engaging their students with different topics in the secondary mathematics curriculum. In other words, the point of the assignment was not to devise a full-blown lesson plan on this topic. Instead, I asked my students to think about three different ways of getting their students interested in the topic in the first place.
I plan to share some of the best of these ideas on this blog (after asking my students’ permission, of course).
This first student submission comes from my former student Jesse Faltys (who, by the way, was the instigator for me starting this blog in the first place). Her topic: how to engage students when teaching one-step and two-step inequalities.
A. Applications – How could you as a teacher create an activity or project that involves your topic?
- Index Card Game: Make two sets of cards. The first should consist of different inequalities. The second should consist of the matching graph. Put your students in pairs and distribute both sets of cards. The students will then practice solving their inequalities and determine which graph illustrates which inequality.
- Inequality Friends: Distribute index cards with simple inequalities to a handful of your students (four or five different inequalities) and to the rest of the students pass of cards that only contain numbers. Have your students rotate around the room and determine if their numbers and inequalities are compatible or not. If they know that their number belongs with that inequality then the students should become “members” and form a group. Once all the students have formed their groups, they should present to the class how they solved their inequality and why all their numbers are “members” of that group.
Both applications allow for a quick assessment by the teacher. Having the students initially work in pairs to explore the inequality and its matching graph allows for discover on their own. While ending the class with a group activity allows the teacher to make individual assessments on each student.
B. Curriculum: How does this topic extend what your students should have learned in previous courses?
In a previous course, students learned to solve one- and two-step linear equations. The process for solving one-step equality is similar to the process of solving a one-step inequality. Properties of Inequalities are used to isolate the variable on one side of the inequality. These properties are listed below. The students should have knowledge of these from the previous course; therefore not overwhelmed with new rules.
Properties of Inequality
1. When you add or subtract the same number from each side of an inequality, the inequality remains true. (Same as previous knowledge with solving one-step equations)
2. When you multiply or divide each side of an inequality by a positive number, the inequality remains true. (Same as previous knowledge with solving one-step equations)
3. When you multiply or divide each side of an inequality by a negative number, the direction of the inequality symbol must be reversed for the inequality to remain true. (THIS IS DIFFERENT)
There is one obvious difference when working with inequalities and multiply/dividing by a negative number there is a change in the inequality symbol. By pointing out to the student, that they are using what they already know with just one adjustment to the rules could help ease their mind on a new subject matter.
C. Culture – How has this topic appeared in pop culture?
Amusement Parks – If you have ever been to an amusement park, you are familiar with the height requirements on many of the rides. The provide chart below shows the rides at Disney that require 35 inches or taller to be able to ride. What rides will you ride?
(Height of Student 
| Blizzard Beach | Summit Plummet | 48″ |
| Magic Kingdom | Barnstormer at Goofy’s Wiseacres Farm | 35″ |
| Animal Kingdom | Primeval Whirl | 48″ |
| Blizzard Beach | Downhill Double Dipper | 48″ |
| DisneyQuest | Mighty Ducks Pinball Slam | 48″ |
| Typhoon Lagoon | Bay Slide | 52″ |
| Animal Kingdom | Kali River Rapids | 38″ |
| DisneyQuest | Buzz Lightyear’s AstroBlaster | 51″ |
| DisneyQuest | Cyberspace Mountain | 51″ |
| Epcot | Test Track | 40″ |
| Epcot | Soarin’ | 40″ |
| Hollywood Studios | Star Tours: The Adventures Continue | 40″ |
| Magic Kingdom | Space Mountain | 44″ |
| Magic Kingdom | Stitch’s Great Escape | 40″ |
| Typhoon Lagoon | Humunga Kowabunga | 48″ |
| Animal Kingdom | Expedition Everest | 44″ |
| Blizzard Beach | Cross Country Creek | 48″ |
| Epcot | Mission Space | 44″ |
| Hollywood Studios | The Twilight Zone Tower of Terror | 40″ |
| Hollywood Studios | Rock ‘n’ Roller Coaster Starring Aerosmith | 48″ |
| Magic Kingdom | Splash Mountain | 40″ |
| Magic Kingdom | Big Thunder Mountain Railroad | 40″ |
| Animal Kingdom | Dinosaur | 40″ |
| Epcot | Wonders of Life / Body Wars | 40″ |
| Blizzard Beach | Summit Plummet | 48″ |
| Magic Kingdom | Barnstormer at Goofy’s Wiseacres Farm | 35″ |
| Animal Kingdom | Primeval Whirl | 48″ |
| Blizzard Beach | Downhill Double Dipper | 48″ |
| DisneyQuest | Mighty Ducks Pinball Slam | 48″ |
| Typhoon Lagoon | Bay Slide | 52″ |
Sports – Zdeno Chara is the tallest person who has ever played in the NHL. He is 206 cm tall and is allowed to use a stick that is longer than the NHL’s maximum allowable length. The official rulebook of the NHL state limits for the equipment players can use. One of these rules states that no hockey stick can exceed160 cm. (Hockey stick 

Weather – Every time the news is on our culture references inequalities by the range in the temperature throughout the day. For example, the most extreme change in temperature in Canada took place in January 1962 in Pincher Creek, Alberta. A warm, dry wind, known as a chinook, raised the temperature from -19 °C to 22 °C in one hour. Represent the temperature during this hour using a double inequality. (-19 < the temperature < 22) What Inequality is today from the weather in 1962?
Geometric magic trick
This is a magic trick that my math teacher taught me when I was about 13 or 14. I’ve found that it’s a big hit when performed for grade-school children.
Magician: Tell me a number between 3 and 10.
Child: (gives a number, call it
)
Magician: On a piece of paper, draw a shape with
Child: (draws a figure; an example for
is shown)
Important Note: For this trick to work, the original shape has to be convex… something shaped like an L or M won’t work. Also, I chose a maximum of 10 mostly for ease of drawing and counting (and, for later, calculating).
Magician: Tell me another number between 3 and 10.
Child: (gives a number, call it
)
Magician: Now draw that many dots inside of your shape.
Child: (starts drawing
) While the child does this, the Magician calculates
, writes the answer on a piece of paper, and turns the answer face down.
Magician: Now connect the dots with lines until you get all triangles. Just be sure that no two lines cross each other.
Child: (connects the dots until the shape is divided into triangles; an example is shown)
Magician: Now count the number of triangles.
Child: (counts the triangles)
Magician: Was your answer… (and turns the answer over)?


The reason this magic trick works so well is that it’s so counter-intuitive. No matter what convex 


Why does this magic trick work? I offer a thought bubble if you’d like to think about it before scrolling down to see the answer.
 This trick works by counting the measures of all the angles in two different ways.
Method #1: If there are 


 Method #2: The sum of the measures of the angles around each interior point is

 The measures of the remaining angles add up to the sum of the measures of the interior angles of a convex polygon with
 In other words, it must be the case that


Statistical significance
When teaching my Applied Statistics class, I’ll often use the following xkcd comic to reinforce the meaning of statistical significance.

The idea that’s being communicated is that, when performing an hypothesis test, the observed significance level 

In practice, statisticians use the Bonferroni correction when performing multiple simultaneous tests to avoid the erroneous conclusion displayed in the comic.
Source: http://www.xkcd.com/882/
Engaging students in a different discipline
I have no expertise about how to teach any other subject besides mathematics. But this article from the May/June 2013 issue of the Stanford alumni magazine made a lot of sense to me about how to teach history to middle- and high-school students. The basic principle appears to be the same that governs my classes: figure out a way to make students want to come to class each day. A sample quote:
I easily could have told them in one minute that the Dust Bowl was the result of overgrazing and over-farming and World War I overproduction, combined with droughts that had been plaguing that area forever, but they wouldn’t remember it.” By reading these challenging documents and discovering history for themselves, he says, “not only will they remember the content, they’ll develop skills for life.
For history, the widespread implementation of this teaching philosophy has apparently been hindered by the lack of adequate teaching materials, which is also addressed in this article.
Dimensions
As described by the March 2013 issue of the American Mathematical Monthly, the (free!) two-hour movie Dimensions is “an impressive computer-generated video of almost 2 hours that describes geometry in two, three and four dimensions. The video assumes an elementary geometry background possessed by most viewers and leads up to an interesting geometric structure, the Hopf fibration of the unit sphere in four-dimensional space.”
The website of this project can be found at http://www.dimensions-math.org.
Here’s the 4-minute trailer for the movie:
This full two-hour movie was uploaded to YouTube in several chapters. The full YouTube playlist is given here.
The links to the 9 separate chapters are below.
