Engaging students: Solving one-step algebra problems

In my capstone class for future secondary math teachers, I ask my students to come up with ideas for engaging their students with different topics in the secondary mathematics curriculum. In other words, the point of the assignment was not to devise a full-blown lesson plan on this topic. Instead, I asked my students to think about three different ways of getting their students interested in the topic in the first place.

I plan to share some of the best of these ideas on this blog (after asking my students’ permission, of course).

This student submission again comes from my former student Emma White. Her topic, from Algebra: solving one-step algebra problems.

green line

How can this topic be used in your students’ future courses in mathematics or science?

Solving one-step algebra problems strings into many future scenarios the student may (and will probably) encounter. One-step algebra problems infer that there must be two-step algebra problems and three-step algebra problems and so forth. As mathematicians, we know this to be true. While mathematics in my focus of study, I want to show the importance of learning this concept as it will aid in other classes. Stoichiometry is a concept taught in chemistry that has to do with the “relationship between reactants and products in a reaction” (Washington University in St. Louis, 2005). Chemical reactions require a balance. Essentially, once-step algebra expressions require just the same where both sides of the equations must be equal for the expression to be true. An example of a stoichiometry equation one may see in chemistry would be:

_KMnO{}_4 + _HCl → _MnCl{}_2 + _KCl + _Cl{}_2 + _H{}_2O

In the blanks, a variable can be placed, such that:

aKMnO{}_4 + bHCl → cMnCl{}_2 + dKCl + eCl{}_2 + fH{}_2O

Next, we would apply the Conservation of Mass. This concept deals with the number of atoms that must be on each side for the equation to be balanced. Writing the elements and their balanced equations with the variables, it follows:

K: a = d
Mn: a = c
O: 4a = f
H: b = 2f
Cl: b = 2c + d + 2e

As we can see, there is going to be more expressions and substitutions that must take place. That is something you can solve on your own if you wish. Overall, we see the importance of learning one-step algebra problems because this will be the foundation for solving more complex questions, even more so outside of the math classroom.

green line

How has this topic appeared in high culture (art, classical music, theatre, etc.)?

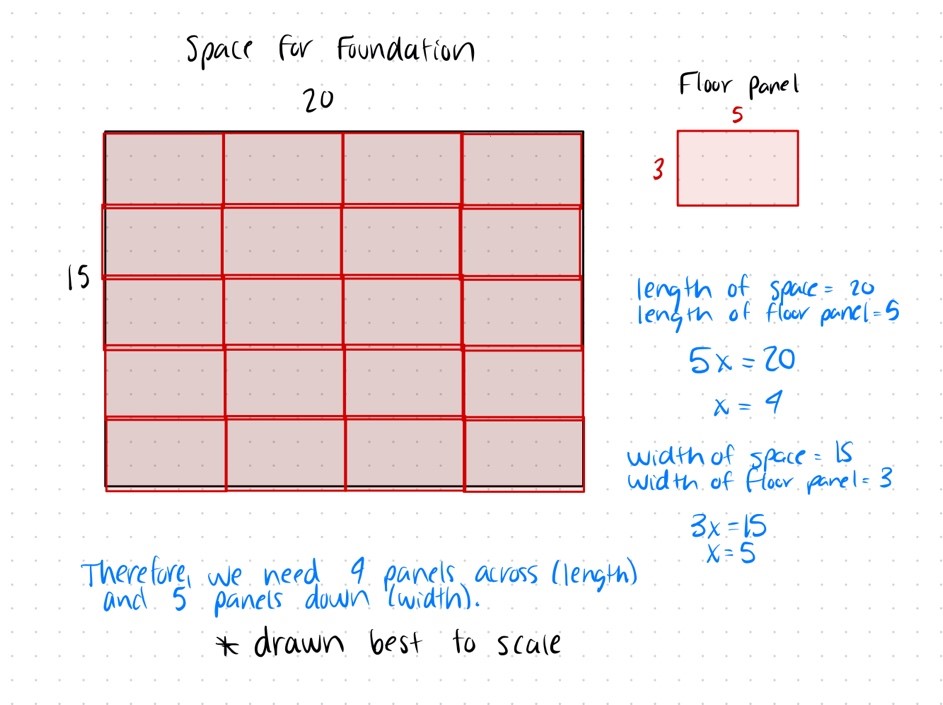
Theatre is more than the actors on the stage. While the performance and show are the part most people acknowledge and enjoy, the technical part behind the performance is what allows the show to happen. Algebraic problems are often used in technical theatre, especially when it comes to building a set. A prime example is building a single foundation (usually used in One Act plays where the whole play takes place in one scene). Focusing on a rectangular foundation, if we know the amount of space the actors, set, and featuring décor need, we can use this in an algebraic expression. Furthermore, if we also know dimensions of one of the sides (length or width), a variable can be used for the unknown side (since the area of a rectangle is length times the width). If we want to take this a step further, multiple one-step algebraic expressions can be used when making the foundation. If we know the length and width of the foundation and the length and width of the sheet floorboards to be used, we can write various expressions to determine how many sheet floorboards need to be used lengthwise and widthwise (example shown below).

green line

How can technology (YouTube, Khan Academy [khanacademy.org], Vi Hart, Geometers Sketchpad, graphing calculators, etc.) be used to effectively engage students with this topic?      

The use of technology is on the rise and the involvement of newer generations is greatly rising as well. Because of this, utilizing online resources is an effective way to capture the attention of the students and make math more engaging. Using algebra tiles is a perfect way to resemble this topic, even more so when it can be done online. Therefore, the teacher does not need to buy any materials and the students (especially high schoolers) don’t have to carry paper resources around or even home where, we all know, they will end up in the trash. Online algebra tiles provide a way to visually see the one-step algebra problem and work accordingly. Even so, these tiles can be an introduction and foundation on what is to come (these tiles are also a great source for solving two-step equations, distribution, polynomials, the perfect square, and so forth). Another insight for using online algebra tiles is in some schools where technology such as tablets/computers are provided, the students can share their screens to a projector (or whatever resources the classroom may have) and describe their thinking process to the class. This builds on the idea of students learning, processing, and being able to teach their peers what they learned as well.

References

End Result for x +4=8: https://technology.cpm.org/general/tiles/?tiledata=b5____g+afx__boy__aaapTtPhF%2B__qvtTauq7tSaurDtSaur5tSausBtSauwisCauwis4auwitAauwit2auwir6auwiuyauwiu0auwirEawq7ukawrDukawr5ukawsBukawwOrEawwOr6awwOsCawwOs4hFProblem%3A%20Solve%20for%20x.%20%20x%20%2B%204%20%3D%208__qPpBhFThere%20is%20one%20x%20left%20on%20the%20left%20sideand%20four%201s%20left%20over%20on%20the%20right.Therefore%2C%20x%20%3D%204.__v-wcgawWwOtBgawWwOt1gawWwOuzgawWwOu0

End Result for 4x=16: https://technology.cpm.org/general/tiles/?tiledata=b5____g+afx__boy__aaatCsnaatCtgaatCviaatCulauvIslauwaslauwGslauw8slauw6tjauwEtjauv8tjauvGtjauvFupauv7upauwDupauw5upauvDvlauv5vlauwBvlauw3vlhF%20%20%20%20%20Look%20at%20one%20x%20on%20the%20left%20side%20and%20seewhat%20it%20is%20paired%20with%20on%20the%20right%20side.We%20see%20that%20one%20x%20is%20paired%20with%20four%201s.Therefore%2C%20x%20%3D%204.__vuwngaqAr8vkgawZxzvnhFProblem%3A%20Solve%20for%20x.%204x%3D16__pEpz
https://chemistrytutor.me/balancing-chemical-equations-algebra/
http://www.chemistry.wustl.edu/~coursedev/Online%20tutorials/Stoichiometry.htm
https://technology.cpm.org/general/tiles/

Engaging students: Finding points on the coordinate plane

In my capstone class for future secondary math teachers, I ask my students to come up with ideas for engaging their students with different topics in the secondary mathematics curriculum. In other words, the point of the assignment was not to devise a full-blown lesson plan on this topic. Instead, I asked my students to think about three different ways of getting their students interested in the topic in the first place.

I plan to share some of the best of these ideas on this blog (after asking my students’ permission, of course).

This student submission comes from my former student Morgan Mayfield. His topic, from Pre-Algebra: finding points on the coordinate plane.

green line

C2: How has this topic appeared in high culture (art, classical music, theatre, etc.)?

One popular art/sport high school students may take part in is marching band. I did four years of marching band in high school and I loved it. One has to wonder: “how does each performer know where they should be?” I’ve included a link from bandtek.com that describes the coordinate system marching bands use. It isn’t quite the same as the coordinate plane in a math class. When starting marching band, you learn how to take appropriately sized “8 to 5” steps, which simply means 8 equally spaced steps for every 5 yards on a football field. Each member will receive little cards that have “sets” on them. A set is a specific point on the field where the performer must be at a specific time of the show. Usually, performers will take straight paths from set to set in a specific amount of 8-5 steps. Looking at a bird eye’s view of the football field, one can see a rough coordinate plane. Like a coordinate plane has 4 quadrants, a football field has a rough 4 quadrant system where a performer is assigned to stand a specified amount of 8-5 steps from a specified yard line either on side 1 or 2 for their horizontal position and a specified amount of 8-5 steps from the front/back hash for vertical position facing the home sideline. Side 1 refers to the left side of the field from the home side perspective, Side 2 refers to the right side of the field from the home side perspective, and the front/back hash refers to the line of dashes that cut through the middle of the field horizontally from the home side perspective.

An example bandtek.com uses is, “4 outside the side 1 45, 3 in front of the front hash” which would mean the following position:

green line

D1: What interesting things can you say about the people who contributed to the discovery and/or the development of this topic?

René Descartes was a 17th century (1600’s) French mathematician and philosopher. Many people study his work in modern day math and philosophy classes. Some may know him as the man who wrote “cogito, ergo sum” or “I think, therefore I am”. Well, there is a legend about his discovery of the Coordinate Plane. Descartes was often sick as a kid, way before modern medication and technology. He would often have to stay in bed at his boarding school until noon because of his illnesses. This gave him quite a bit of downtime to be observant of his environment. Laying on his bed, he could see a fly crawl around on his ceiling. He thought of ways to describe the location of the fly as it scuttled about the ceiling. Imagine telling a friend where the location of the fly was, “A little to the left of the right wall and a little down from the top wall”. This just isn’t precise enough, nor an easy way to communicate information. However, Descartes realized he could quantify the precise location of the fly from using the distance from a pair of perpendicular walls. Descartes then translated this idea onto a graph where the perpendicular “walls” continued infinitely in both directions and became “axes”. “Flies” then became “points” or “coordinate pairs”. Thus, the coordinate plane was born, and so was a way to describe points in space. Just a little bit of imagination, self-questioning, and observation lead to a fundamental change in Mathematics, a way to tie Algebra and Geometry together.


green line

E1: How can technology (YouTube, Khan Academy [khanacademy.org], Vi Hart, Geometers Sketchpad, graphing calculators, etc.) be used to effectively engage students with this topic? Note: It’s not enough to say “such-and-such is a great website”; you need to explain in some detail why it’s a great website.


I believe that https://www.chess.com/vision could be an effective website to engage students on finding points on the coordinate plane in a class that is being introduced to the idea for the first time. Many students won’t know how a chessboard is setup or even know how to play chess. The cool things are that they don’t need to know the fundamentals of chess and that the chessboard is essentially Quadrant I of a coordinate plane (where a1 is in the bottom left corner). The above website tests the player to locate as many squares (points) on a chessboard (coordinate plane) as they can in 30 seconds, given random chess coordinates. There is a way to toggle settings to also test yourself on moves and squares. In a classroom, I would only toggle the setting to list random “black and white squares” where the board is set with a1 at the bottom left corner. Students could start the day with this website as a precursor to formalizing the idea of finding points on a coordinate plane. This website is engaging (with an exclamation point)! The game can be made into a fun little competition amongst students. The time limit and game-y feeling to it encourages active participation. The game takes minimal explanation from the teacher for students to get the hang of it (no chess skills required). The fact that chessboards have one axis in letters and the other axis in numbers aids students in reading the coordinate plane x-axis first, then y-axis like the chess coordinates. I would only have the students run the game for a few rounds, making the activity in total 7 minutes or less.


References:

http://bandtek.com/how-to-read-a-drill-chart/

https://www.chess.com/vision

https://wild.maths.org/ren%C3%A9-descartes-and-fly-ceiling

Have you ever followed a Fly?

Engaging students: Making and interpreting bar charts, frequency charts, pie charts, and histograms

In my capstone class for future secondary math teachers, I ask my students to come up with ideas for engaging their students with different topics in the secondary mathematics curriculum. In other words, the point of the assignment was not to devise a full-blown lesson plan on this topic. Instead, I asked my students to think about three different ways of getting their students interested in the topic in the first place.

I plan to share some of the best of these ideas on this blog (after asking my students’ permission, of course).

This student submission comes from my former student Taylor Bigelow. Her topic, from Pre-Algebra: making and interpreting bar charts, frequency charts, pie charts, and histograms.

green line

How could you as a teacher create an activity or project that involves your topic?

Charts allow for a lot of fun class activities. For example, we can have them take their own data for a table and create charts from that data. For my activity, I will give them all dice, which they should be very familiar with, and have them roll the dice 20 times and keep track of how many times it lands on each number in a table. From that table, they will make their own bar charts, frequency charts, and pie charts. After they roll their dice and make their charts, they will then answer questions interpreting the charts. This tests their ability to understand data and make all the different types of charts.

green line

How has this topic appeared in the news?

Charts are all over in the news, especially recently. There were pie charts and frequency charts all over during the election cycle, and with covid, all we see is bar charts of covid data. An easy engage for this topic would be to make observations about these types of graphs that they’ll probably see all the time during election seasons and might even be familiar with. First, we will ask the students what news can benefit from graphs, and what news they have seen graphs in recently. I expect answers similar to elections, covid, and economics. Then we can look at some of the graphs that usually show up around election cycles. We will take a minute as a class to discuss what they notice about the graphs and what they mean. Questions like “what type of graph is this”, “what are the variables in this graph”, and “what information do you get from this graph”. This will show the students that being able to read these graphs has real life applications, and it also teaches them what important things to look for in the graphs during class time and homework.

green line

How can technology be used to effectively engage students with this topic?

Technology is very useful for making graphs and being able to make and manipulate graphs can help them understand how to interpret the information given in graphs. Google sheets or excel can both be used to make and manipulate graphs. For this activity we would give the students some sample data and have them enter it into an online spreadsheet, and then make an appropriate graph to show this data. They then would answer questions about this graph, like “Why did you choose this type of graph to represent the data?”, “what is the independent variable and what is the dependent variable”, “What observations can you make about this graph?”, and “What would happen if you changed X to be # instead? Or if you added more information?” and other questions, especially about graphs with multiple variables. This helps students see how different information can be represented and lets them experiment with the information on their own, while also answering questions that steer them in the direction that the teacher wants them to know.

Engaging students: Powers and exponents

In my capstone class for future secondary math teachers, I ask my students to come up with ideas for engaging their students with different topics in the secondary mathematics curriculum. In other words, the point of the assignment was not to devise a full-blown lesson plan on this topic. Instead, I asked my students to think about three different ways of getting their students interested in the topic in the first place.

I plan to share some of the best of these ideas on this blog (after asking my students’ permission, of course).

This student submission comes from my former student Austin Stone. His topic, from Pre-Algebra: powers and exponents.

green line

What interesting (i.e., uncontrived) word problems using this topic can your students do now?

“The number of people who are infected with COVID-19 can double each day. If it does double every day, and one person was infected on day 0, how many people would be infected after 20 days?” This problem can be a current real-life word problem that all students can relate to given the times we are in. This problem would be a good introductory for students to see how quickly numbers can get when using exponents. This would be an engaging introductory to exponents and will get the students interested because they can easily see that this can be used in current problems facing the world. This problem could also work later in Algebra if you ask how many days it would take to infect “blank” amount of people. This makes the question more of a challenge because they would have to solve for “x” (days) which is the exponent.

green line

How has this topic appeared in the news?

This topic has been the news so far in 2020 if we are being honest. COVID-19 is a virus that has an exponential infection rate, just like any virus. When talking about COVID-19, news reporters and doctors usually use graphs to depict the infection rate. These graphs start off small but then grow exponentially until it slows down due to either people being more aware of their hygiene habits and/or the human immune system getting more familiar with the virus. Knowing how exponents work helps people better understand the seriousness of viruses such as COVID-19 and the everlasting impact it can have on the world. Doctors study what are the best ways to slow down the exponential growth so that a limited number of people contract and potentially die from the virus. To do this, they predict the exponential growth keeping in mind the regulations that may be enforced. Whatever regulation(s) slow down the virus the most are the ones that they try to enforce.

green line

How can technology (YouTube, Khan Academy [khanacademy.org], Vi Hart, Geometers Sketchpad, graphing calculators, etc.) be used to effectively engage students with this topic?

An easy way to introduce students who have never seen exponents or exponential growth before is to use a graphing calculator. By plugging in an exponential function into the calculator and viewing the graph and zooming out, students can easily see how quickly numbers start to get massively large. A teacher can set this up by giving the students a problem to think about such as, “how many people would be infected with the virus after “blank” amount of day?” Students then could guess what they believe it would be. After revealing the graph and the actual number, students will probably be surprised at how big the number is in just a short amount of time. After that, the teacher could show a video on YouTube about exponential growth and/or infection rates of viruses and how quickly a small virus can turn into a pandemic. This also has very current real-world applications.

Reference: https://www.osfhealthcare.org/blog/superspreaders-these-factors-affect-how-fast-covid-19-can-spread/

Engaging students: Finding the slope of a line

In my capstone class for future secondary math teachers, I ask my students to come up with ideas for engaging their students with different topics in the secondary mathematics curriculum. In other words, the point of the assignment was not to devise a full-blown lesson plan on this topic. Instead, I asked my students to think about three different ways of getting their students interested in the topic in the first place.

I plan to share some of the best of these ideas on this blog (after asking my students’ permission, of course).

This student submission again comes from my former student Austin Stone. His topic, from Algebra: finding the slope of a line.

green line

How could you as a teacher create an activity or project that involves your topic?

Using “pull back” toy cars, you can create a fun little activity that students can compete in to see who wins. Students can be put into groups or do it individually depending on how many cars you have available. The idea of the activity would have students pull back the cars a small amount and record how far they took it back and how far the car went. After doing this from three or four different distances, the students would then graph their data with x=how far they took it back and y=how far the car went. Then the teacher would tell the students to find how far back they would need to pull for the car to go a specified distance by finding the slope of their line (or rate of change in this example). After students have done their calculations, they would then pull back their cars however far they calculated and the closest team to the distance gets a prize.

green line

How can this topic be used in your students’ future courses in mathematics or science?

Students will continually use slope throughout their future math and science classes. In math courses, slope is used to graph data and predict what will happen if certain numbers are used. It is also used to notice observations about the graph such as steepness (how quickly it changes) and if the rate of change is increasing or decreasing. It is also used in science for very similar reasons. In physics, slope is used commonly to calculate velocity and force. In chemistry labs, slope is used to predict how much of a certain substance needs to be added to find observational differences. In calculus, when taking the first derivative of a function, if the slope is negative, then the function is decreasing during that interval and vice versa if it is positive. Slope is also widely used in Algebra II, so learning how to find the slope is very important for future math and science classes whether it be in high school or college.

green line

How does this topic extend what your students should have learned in previous courses?

Students should have already learned how to graph points on the coordinate plane. They can take this knowledge and now not only plot seemingly random points, but now see the relationship between these points. Plotting points is a skill usually learned around 6th grade and is used regularly after that. Also, finding the x and y axis can be used when finding the slope of a line. If you have a function with no points, finding the x and y axis can let you find the slope. Finding the x and y axis is learned in Algebra I so this would be fresh on students’ minds. Finding the slope of a line can be scaffolded with finding the x and y axis in lectures or in PBL experience. Also refreshing students on how to graph not only in the first quadrant, but in all four quadrants could be a quick little activity at the beginning of the PBL experience.

Reference:

http://www.andrewbusch.us/home/racing-day-algebra-2

Engaging students: Multiplying binomials

In my capstone class for future secondary math teachers, I ask my students to come up with ideas for engaging their students with different topics in the secondary mathematics curriculum. In other words, the point of the assignment was not to devise a full-blown lesson plan on this topic. Instead, I asked my students to think about three different ways of getting their students interested in the topic in the first place.

I plan to share some of the best of these ideas on this blog (after asking my students’ permission, of course).

This student submission again comes from my former student Cire Jauregui. Her topic, from Algebra: multiplying binomials.

green line

How can technology be used to effectively engage students with this topic?

Khan Academy has a whole series of videos, practice problems, and models to help students learn about multiplying binomials. The first in this series is a video visualizing the problem (x+2)(x+3) as a rectangle and explains that multiplying the binomials would give the area taken up by the rectangle. This would help students connect multiplying binomials to multiplying numbers to find area. This can also help students who learn better with visual examples by giving them a way to show a picture demonstrating the problem they are multiplying. Khan Academy then moves from using a visual representation to a strictly alpha-numerical representation so students can smoothly transition from having the pictures drawn out to just working out the problem. The first video in the series of pages at Khan Academy can be found at this link: https://tinyurl.com/KhanAcademyBinomials

green line

How does this topic extend what your students should have learned in previous courses?

Multiplying binomials extends on two-digit times two-digit multiplication that students learn and practice in elementary and middle school courses. This video from the platform TikTok by a high school teacher Christine (@thesuburbanfarmhouse) shows the connection between vertical multiplication of two numbers and the multiplication of binomials together: https://tinyurl.com/TikTokFOIL By showing students that it works the same way as other forms of multiplication that they have already seen and hopefully mastered, it sets the students up to view the multiplication of binomials and other polynomials in a way that is familiar and more comfortable. This particular video is part of a miniature series that Christine recently did explaining why slang terms such as FOIL (standing for “first, outside, inside, last” as a way to remember how to multiply binomials) which many classrooms have used (including my own high school teachers), which are helpful when initially explaining multiplication of binomials, ultimately can be confusing to students when they move on to multiplying other polynomials. I personally will be staying away from using terms like FOIL because as students move on to trinomials and other larger polynomials, there are more terms to distribute than just the four mentioned in FOIL.

green line

How can this topic be used in your students’ future courses in mathematics or science?

As I mentioned in the last question, learning to multiply binomials can lead students to success in multiplying polynomials. This skill can also help students factor polynomials in that it can help them check their answers when they are finished. It can also help them recognize familiar-looking polynomials as having possible binomials as factors. If a student were to see 12x2-29x-8 and couldn’t remember how to go about factoring it in other ways, a student could use a guess-and-check method to factor. They might try various combinations of (Ax+B)(Cx-D) until they find a satisfactory of A, B, C, and D that when the binomial is multiplied, creates the polynomial they were trying to factor. Without solid skills in multiplying binomials, a student would likely be frustrated in trying to find what A, B, C, and D as their multiplication could be wrong and seemingly no combination of numbers works.

Engaging students: Solving absolute value equations

In my capstone class for future secondary math teachers, I ask my students to come up with ideas for engaging their students with different topics in the secondary mathematics curriculum. In other words, the point of the assignment was not to devise a full-blown lesson plan on this topic. Instead, I asked my students to think about three different ways of getting their students interested in the topic in the first place.

I plan to share some of the best of these ideas on this blog (after asking my students’ permission, of course).

This student submission again comes from my former student Conner Dunn. His topic, from Algebra: solving absolute value equations.

green line

How could you as a teacher create an activity or project that involves your topic?

This topic is an excellent concept for algebra students wanting real life applications when learning math concepts. In creating an activity relevant to this, the “real life” concept I’d want to emphasize is distance, which conveniently is in the definition of absolute value. Distance can be expressed in words or in pictures, and specifically with absolute value, we model distance as a one-dimensional (one variable) function. To express a model like this, I’d want get students to know what the numbers and operations can mean for a distance problem. For example, a student should be able to know that |x-7| = 3 can be expressed as “the distance between x and 7 is 3.” The potential activity here is to get students to either express absolute-value equations in words or vice versus. The same concept of distance can be played out in pictural or graphical representations. Obviously, I can use absolute value graphs to model this, but I would specifically look at one-dimensional representation and maybe have students try and model a situation using absolute value equations. It’ll be in these activities that I could really nail down true meanings of 2-solution, 1 solution, or no solution problems and why, for example, they have to check for extraneous solutions when solving.

green line

How can this topic be used in your students’ future courses in mathematics or science?

The concept of solving this type of equation is really relevant and similar to that of solving for quadratic equations as well as polynomial equations in general. When students are able to grasp the concept of having 0, 1, or 2 solutions in an absolute value equation and know why, they’ll be using this understanding when solving for polynomials of high degrees. I’d also like to imagine students might want to make the connection to midpoints in Geometry. Absolute value equations can tell the 1-dimensional distance from a point to another two points in either direction. When Geometry students see this modelled on a number line, they may be able to identify 3 points equidistant from one another forming 2 congruent segments.

green line

How does this topic extend what your students should have learned in previous courses?

The things I would teach about solving absolute value equations really build off students’ understanding of equivalence and the properties about it that they use when asked to “solve” for anything an algebra class. One of the big steps in solving a|bx+c| + d = e is described as “solving for the absolute value.” This step builds off students’ previous works of “solving for x.” The solution for connecting these is clear: just let the “x” or rather the variable to solve for be the absolute value, and then solve for it using those equivalence properties they know. The great thing about this is that it builds on the idea that when solving for unknown variables, it’s okay to not immediately know them. Equiveillance properties are tools that students can use to work towards solving for unknowns. The more accustomed students are to these tools, the better, so when throwing in absolute values into the mix, it makes for good practice in using “equivalence tools.”

Engaging students: Adding and subtracting polynomials

In my capstone class for future secondary math teachers, I ask my students to come up with ideas for engaging their students with different topics in the secondary mathematics curriculum. In other words, the point of the assignment was not to devise a full-blown lesson plan on this topic. Instead, I asked my students to think about three different ways of getting their students interested in the topic in the first place.

I plan to share some of the best of these ideas on this blog (after asking my students’ permission, of course).

This student submission comes from my former student Enrique Alegria. His topic, from Algebra: multiplying polynomials.

green line

How can this topic be used in your students’ future courses in mathematics and science?

This topic can be used in students’ future courses in mathematics by simplifying expressions of increasing degree. In Algebra II students are expected to simplifying polynomials of varying degrees as they move on to multiplying and dividing polynomials. From there determining the factors of a polynomial of degree three and degree four. Real-world problems can be solved through the simplification of several like terms. Each term representing a specific part of the problem. We can even compare the addition and subtraction of polynomials to runtime analysis in Computer Science. Measuring the change in the degree and how that affects the output. In a way, this can translate to the runtime of a program. For example, a chain of commands with a constant time is run. A loop is nested in another loop that is placed after the first expressions. This has changed the overall runtime of the program from constant time to quadratic because of the degree of the nested loops. The overall time would be the addition of the expressions and their corresponding times.

green line

How does this topic extend what your students have learned in previous courses?

This topic extends from the early concept, ‘Combining Like Terms.’ Starting with adding and subtracting items of similar groupings such as 8 apples and 4 apples altogether are 12 apples. Bringing students to place value such as adding 3 ones and 2 ones to adding multi-digit numbers. We then leap towards Algebra introducing expressions and equations. Learning about linear and quadratic equations and graphing them. Students should have learned about monomials in correspondence with coefficients and exponents. From there, students are familiar with algebraic terms. Those are the building blocks that we are going to be expanding upon. Once students familiarize themselves with several terms in an expression, they will focus on adding or subtracting like terms by focusing on both the coefficient, term, and exponents on the variables. Shortly after the students can continue to be challenged by using terms such as 6xy or 3a^2b^3+4a^2b^3c^2 to focus on the terms and confirm if they are ‘like’ to be combined or just notice the fact that they have some common variables with the same exponents but with a slight difference other than the coefficient, the expression cannot be simplified as one may think.

green line

How can technology (YouTube, Khan Academy [khanacademy.org], Vi Hart, Geometers Sketchpad, graphing calculators, etc.) be used to effectively engage students with this topic?

Adding and subtracting polynomials can be engaging to students with the help of Brilliant. This site starts with helping students identifying polynomials and their degrees to help students understand how to describe them. Then moving to the arithmetic of polynomials performing addition and subtraction operations on the polynomial numbers. This source goes through polynomials through challenging and insightful exercises. For example, a quadrilateral of sides such as 5, 3x+4, 4x+1, 17x-10, and from there simplifying the expression. Students would be able to substitute values and determine if a specific quadrilateral has been made. I can have students go through a few exercises as a class or on their own and then they can come up with a problem on their own that would be posted to the ‘public’ (which would be only their class) so that the students will be able to have classroom interaction and grow as they challenge each other. Students can apply this concept by creating a large polynomial expression and then simplifying it and lastly graphing the equation.

References:

Polynomials. Brilliant.org., from https://brilliant.org/wiki/polynomials/

Simplifying Expressions. Brilliant.org., from https://brilliant.org/wiki/simplifying-expressions/

Engaging students: Solving systems of linear inequalities

In my capstone class for future secondary math teachers, I ask my students to come up with ideas for engaging their students with different topics in the secondary mathematics curriculum. In other words, the point of the assignment was not to devise a full-blown lesson plan on this topic. Instead, I asked my students to think about three different ways of getting their students interested in the topic in the first place. I plan to share some of the best of these ideas on this blog (after asking my students’ permission, of course). This student submission again comes from my former student Angelica Albarracin. Her topic, from Algebra: solving linear systems of inequalities. green line What interesting (i.e., uncontrived) word problems using this topic can your students do now? One example of an interesting word problem students can do using this topic is based on a technique astronomers use to learn about celestial bodies. Being able to assess the number of craters a body has on its surface can reveal information about the body’s age, as well as its history of impacts. In comparing the number of craters two bodies have experienced over time, astronomers are able to compare their lifetimes and hypothesize reasons for differences and/or similarities. This image has an empty alt attribute; its file name is crater1.png
Taken from https://spacemath.gsfc.nasa.gov/algebra2.html
Another example of an interesting word problem pertains to determining whether a specific phone plan is best for you. When choosing between certain plans, individuals may have to decide between a higher flat fee and a lower rate per minute or a lower flat fee and a higher rate per minute. In many cases, the answer may not be so obvious so to be able to figure out which is the best deal can prove to be a very helpful money saver. Of course, the answer to this question depends on how many minutes an individual plans to use a month, but we can use linear systems of equations to find out at which point do the plans differ, and thus finding a starting point to the solution. This image has an empty alt attribute; its file name is phone1.png This image has an empty alt attribute; its file name is phone2.png Taken from https://students.ga.desire2learn.com/d2l/lor/viewer/viewFile.d2lfile/1798/12938/Algebra_ReasoningwithEquationsandInequalities12.html green line How does this topic extend what your students should have learned in previous courses? In previous courses, students should have learned about x and y intercepts and solving linear equations. Solving linear systems of equations is and extension of x and y intercepts because one of the major components in this topic is finding the exact point at which two different linear functions meet. We can think of a typical problem of finding the x or y intercept of a linear function in terms of a system. For example, we can let our first equation be y = 3x + 2 and the second be y = 0. From this we can clearly see that our second equation is the x-axis, and as we are trying to find the point of intersection between a linear function, we end up calculating the x-intercept of our first function. It is also not difficult to see that solving linear systems of equations serves as an extension to solving linear equations. When employing the method of substitution, you must solve for one variable, in terms of the other. This process requires the student to know how to solve singular linear equations, and to apply their solutions through substitution. We can also see an extension regarding graphing linear equations. When solving linear systems of equations by graphing, one must graph each individual linear equation. Once the two individual equations are graphed, the solution can be found by observing the point at which the two equations intersect if at all. green line How can technology be used to effectively engage students with this topic? Desmos is widely regarded for its creative lessons that integrate mathematical topics in fun and engaging ways. For the topic of solving systems of linear equations with graphing and substitution, one such Desmos activity is titled Playing Catch-Up. The first two slides set up an engaging premise where a video compares the running speed of an average person and a professional runner. Further along the activity, the student can see a graphical representation of their speeds and is able to make a prediction as to whether they think one person will pass the other. Aside from being able to see an animated graph that corresponds to the information given in the video, there is also an interesting short answer feature on the first slide. This feature allows the student to ask a question regarding the situation they are presented with in the video. The most helpful part of this feature is that not only can the teacher view the student responses, but also the students can see each other’s responses. This allows for students to communicate with each other in a controlled environment and lead the way for further elaboration on some of the most asked questions. This specific Desmos activity places much of its emphasis on solving systems of linear equations through graphing, however substitution can still have a place in technology. Typically, when students are introduced to this concept, they are taught the graphing method first as its visual component aids in understanding. Graphing isn’t always reasonable however as it is time consuming and you may be faced with equations that are difficult to graph. By using technology such as the Desmos graphing calculator, the teacher can show the student of an example of a linear system of equations that would be unreasonable to solve by graphing. This gives the students reasoning as to why learning another method such as substitution is necessary while also making them consider a possibility that they might not have thought of before. References: https://spacemath.gsfc.nasa.gov/algebra2.html https://students.ga.desire2learn.com/d2l/lor/viewer/viewFile.d2lfile/1798/12938/Algebra_ReasoningwithEquationsandInequalities12.html https://teacher.desmos.com/activitybuilder/custom/5818fb314e762b653c3bf0f3

Engaging students: Solving one- or two-step inequalities

In my capstone class for future secondary math teachers, I ask my students to come up with ideas for engaging their students with different topics in the secondary mathematics curriculum. In other words, the point of the assignment was not to devise a full-blown lesson plan on this topic. Instead, I asked my students to think about three different ways of getting their students interested in the topic in the first place.

I plan to share some of the best of these ideas on this blog (after asking my students’ permission, of course).

This student submission again comes from my former student Jesus Alanis. His topic, from Algebra: solving one- or two-step inequalities.

green line

How could you as a teacher create an activity or project that involves your topic?

As a teacher, the activity I would make so that this topic is more fun is by using the game battleship. When I was in school, learning this lesson for the first time, we did a gallery walk that you would solve for the solutions and would go searching for that solution. Well, you can use the same problems used in a gallery walk. All you would have to do is put it on a worksheet that could be half the solutions of the enemy’s problems and the student’s problems to work on. The student will place(draw) their “ship” on the enemy’s solution. With this activity, you can pair up students and make them go one by one, or since time may be an issue you can make it a race between the two students to see who sinks the opponent’s ships first.

I got the inspiration from here. https://www.algebra-and-beyond.com/blog/bringing-back-battleship

green line

What interesting things can you say about the people who contributed to the discovery and/or the development of this topic?

A brief history of inequalities is that the less than or greater than signs were introduced in 1631 in a book titled “Artis Analyticae Praxis ad Aequationes Algebraicas Resolvendas” created by a British mathematician named Thomas Harriot. An interesting fact is that the creator’s work and the book was published 10 years after his death. A shocking fact is that the actual symbols were created by the book’s editor. At first, the symbols were just triangular symbols that were created by Harriot which was later changed by the editor to what we now know as < and >. A fun fact is that Harriot used parallel lines to symbolized equality, but the parallel lines were vertical, not horizontal as we now know as the equal sign. In the year 1734, a French mathematician named Pierre Bouguer used the less than or equal to and greater than or equal to. Also, there was also another mathematician that use the greater than/ less than symbols but with a horizontal line above them. During these times, the symbols were not yet set in stone and were still being changed. The symbols were actually just triangles and parallel lines to symbolized greater than, less than, greater than or equal to, less than or equal to, and equal to.

green line

How can technology be used to effectively engage students with this topic?

By using technology effectively with this topic, is that I found an online game that has the same idea of the battleship. The website is this: https://www.quia.com/ba/368655.html. The game is online so this is really good resource especially since we are in a pandemic but also an extra resource if the student needs more practice that they can do on their own. This is a good activity for students because I know that there are schools that have in-person classes so each student can use their own computer to prevent any more spreading of the virus while being in the classroom. There are also schools that have classes through Zoom and Google Classroom so they can add this online game as an assignment and make the students have them write down their questions and answers with their work to see the way they work the problems out.

References:

  • Seehorn, Ashley. “The History of Equality Symbols in Math.” Sciencing, Leaf Group Media, 2 Mar. 2019, sciencing.com/history-equality-symbols-math-8143072.html.
  • Lythgoe, Mrs. “Two-Step Inequalities Battleship.” Quia, http://www.quia.com/ba/368655.html.