Recently, I announced that my paper Parabolic Properties from Pieces of String had been published in the magazine Math Horizons. The article had multiple aims; in chronological order of when I first started thinking about them:
Prove that string art from two line segments traces a parabola.
Prove that a quadratic polynomial satisfies the focus-directrix property of a parabola, which is the reverse of the usual logic when students learn conic sections.
Prove the reflective property of parabolas.
Accomplish all of the above without using calculus.
While I’m generally pleased with the final form of the article, the necessity of publication constraints somewhat abbreviated the original goal of this project: determining a pedagogically sound way of convincing a bright Algebra I student that string art unexpectedly produces a parabola. While all the necessary mathematics is in the article, I think the article is somewhat lacking on how to sell the idea to students. So, in this series of posts, I’d like to expand on the article with some pedagogical thoughts about connecting string art to parabolas.
We have shown in the last couple of posts that if the three points that generate the Our explorations of string art led us to consider an arbitrary string depicted below. For brevity, this string will be called “string ,” matching the (possibly non-integer) -coordinate of its left endpoint . Since is units to the right of , the right endpoint must correspondingly be units to the right of . Therefore, the -coordinate of is .
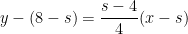
Previously, we established that the equation for string is
.
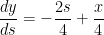
We also obtained a bonus result that we obtained using only algebra: string is tangent to the parabola , which is traced by the strings, when . Of course, tangent lines are usually obtained using calculus, and so calculus should be able to confirm this result. The derivative of this function is
,
so that the slope of the tangent line when is . We observe that this matches the slope of line segment in the above picture:
slope .
Therefore, to show that is the tangent line, it suffices to show that either or is on the tangent line.
At , the coordinate of where the tangent line intersects the curve is
.
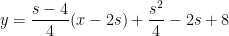
Using the point-slope formula for a line, the equation of the tangent line is thus
.
We now check to see if is on the tangent line. Substituting , we find
Therefore, the point is on the tangent line, thus confirming that is on the tangent line and that is the tangent line.
Recently, I announced that my paper Parabolic Properties from Pieces of String had been published in the magazine Math Horizons. The article had multiple aims; in chronological order of when I first started thinking about them:
Prove that string art from two line segments traces a parabola.
Prove that a quadratic polynomial satisfies the focus-directrix property of a parabola, which is the reverse of the usual logic when students learn conic sections.
Prove the reflective property of parabolas.
Accomplish all of the above without using calculus.
While I’m generally pleased with the final form of the article, the necessity of publication constraints somewhat abbreviated the original goal of this project: determining a pedagogically sound way of convincing a bright Algebra I student that string art unexpectedly produces a parabola. While all the necessary mathematics is in the article, I think the article is somewhat lacking on how to sell the idea to students. So, in this series of posts, I’d like to expand on the article with some pedagogical thoughts about connecting string art to parabolas.
We have shown in the last couple of posts that if the three points that generate the Our explorations of string art led us to consider an arbitrary string depicted below. For brevity, this string will be called “string ,” matching the (possibly non-integer) -coordinate of its left endpoint . Since is units to the right of , the right endpoint must correspondingly be units to the right of . Therefore, the -coordinate of is .
Previously, we established that the equation for string is
.
Finding the curve traced by the strings is a two-step process:
For a fixed value of , find the value of that maximizes .
Find this optimal value of .
Previously, we showed using only algebra that the optimal value of is , corresponding to an optimal value of of .
For a student who knows calculus, the optimal value of can be found by instead solving the equation (or, more accurately, ):
,
matching the result that we found by using only algebra.
Recently, I announced that my paper Parabolic Properties from Pieces of String had been published in the magazine Math Horizons. The article had multiple aims; in chronological order of when I first started thinking about them:
Prove that string art from two line segments traces a parabola.
Prove that a quadratic polynomial satisfies the focus-directrix property of a parabola, which is the reverse of the usual logic when students learn conic sections.
Prove the reflective property of parabolas.
Accomplish all of the above without using calculus.
While I’m generally pleased with the final form of the article, the necessity of publication constraints somewhat abbreviated the original goal of this project: determining a pedagogically sound way of convincing a bright Algebra I student that string art unexpectedly produces a parabola. While all the necessary mathematics is in the article, I think the article is somewhat lacking on how to sell the idea to students. So, in this series of posts, I’d like to expand on the article with some pedagogical thoughts about connecting string art to parabolas.
Our explorations of string art led us to consider an arbitrary string depicted below. For brevity, this string will be called “string ,” matching the (possibly non-integer) -coordinate of its left endpoint . Since is units to the right of , the right endpoint must correspondingly be units to the right of . Therefore, the -coordinate of is .
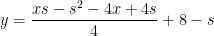
In the previous post, we established that the equation for string is
This has the appearance of a quadratic equation, but it’s actually a linear equation in for a fixed value of . For example, if s = 5, we find that the equation of string 5 is
,
matching the equation of the blue string we found in a previous post in this series.
To prove that the strings trace a parabola, we now determine which string maximizes the value of for a given value of . Algebra students can determine this maximum by recalling that a quadratic function is maximized (for negative ) when . Therefore, the string with largest -coordinate for a given value of is
.
For example, if , then string has the largest -coordinate, matching our previous observations. To complete the proof that the strings above trace a parabola, we substitute into to find the value of this largest coordinate:
,
matching the result that we found earlier in this series.
There’s also a bonus result. We further note that, for every , there is only one string that intersects the parabola . Since each is associated with a unique string and vice versa, we conclude that each string intersects the parabola at exactly one point. In other words, string is tangent to the parabola when .
We note that all of the above calculations were entirely elementary, in the sense that calculus was not used and that only techniques from algebra were employed. That said, the word “elementary” in mathematics can be a bit loaded — this means that it is based on simple ideas that are perhaps used in a profound and surprising way. Perhaps my favorite quote along these lines was this understated gem from the book Three Pearls of Number Theory after the conclusion of a very complicated multi-page proof in Chapter 1:
You see how complicated an entirely elementary construction can sometimes be. And yet this is not an extreme case; in the next chapter you will encounter just as elementary a construction which is considerably more complicated.
In the next post, we take a second look at this derivation using techniques from calculus.
Recently, I announced that my paper Parabolic Properties from Pieces of String had been published in the magazine Math Horizons. The article had multiple aims; in chronological order of when I first started thinking about them:
Prove that string art from two line segments traces a parabola.
Prove that a quadratic polynomial satisfies the focus-directrix property of a parabola, which is the reverse of the usual logic when students learn conic sections.
Prove the reflective property of parabolas.
Accomplish all of the above without using calculus.
While I’m generally pleased with the final form of the article, the necessity of publication constraints somewhat abbreviated the original goal of this project: determining a pedagogically sound way of convincing a bright Algebra I student that string art unexpectedly produces a parabola. While all the necessary mathematics is in the article, I think the article is somewhat lacking on how to sell the idea to students. So, in this series of posts, I’d like to expand on the article with some pedagogical thoughts about connecting string art to parabolas.
As discussed previous posts, we begin our explorations with string art connecting evenly spaced points on line segments and with endpoints , , and . We will call these colored line segments “strings.” We then found the string with the largest coordinate at , resulting in the following picture:
In previous posts, we discussed three different ways of establishing that the colored points lie on the parabola .
Unfortunately, checking that a statement is true for a few points (in our case, ) does not constitute a complete proof for all points. Furthermore, it’s conceivable that “fuller” string art with additional strings, like the picture below, may identify a new string with a higher coordinate than a colored point.
To prove that the string art indeed traces a parabola, we study an arbitrary string depicted below. For brevity, this string will be called “string ,” matching the (possibly non-integer) -coordinate of its left endpoint . Since is units to the right of , the right endpoint must correspondingly be units to the right of . Therefore, the -coordinate of is .
Since the equations of and are and , respectively, the coordinates of and are and , respectively. For example, if , the coordinates of are and the coordinates of are , matching the endpoints of the blue string in the first figure. We now use standard algebraic techniques to find the equation of string . Its slope is
.
The coordinates of either or can now be used to find the equation of string via the point-slope formula. As it turns out, the coordinates of are simpler to use:
to finally arrive at the equation of string :
This has the appearance of a quadratic equation, but it’s actually a linear equation in for a fixed value of . For example, if s = 5, we find that the equation of string 5 is
,
matching the equation of the blue string we found in a previous post in this series.
We are now almost in position to prove that the string art traces a parabola. We demonstrate this in the next post.
Recently, I announced that my paper Parabolic Properties from Pieces of String had been published in the magazine Math Horizons. The article had multiple aims; in chronological order of when I first started thinking about them:
Prove that string art from two line segments traces a parabola.
Prove that a quadratic polynomial satisfies the focus-directrix property of a parabola, which is the reverse of the usual logic when students learn conic sections.
Prove the reflective property of parabolas.
Accomplish all of the above without using calculus.
While I’m generally pleased with the final form of the article, the necessity of publication constraints somewhat abbreviated the original goal of this project: determining a pedagogically sound way of convincing a bright Algebra I student that string art unexpectedly produces a parabola. While all the necessary mathematics is in the article, I think the article is somewhat lacking on how to sell the idea to students. So, in this series of posts, I’d like to expand on the article with some pedagogical thoughts about connecting string art to parabolas.
As discussed previous posts, we begin our explorations with string art connecting evenly spaced points on line segments and with endpoints , , and . We will call these colored line segments “strings.” We then found the string with the largest coordinate at , resulting in the following picture:
However, perhaps it’s clearer to plot these points on a separate graph, without the clutter of the strings:
These points are definitely following some kind of curve. In the previous posts, we established algebraically that the curve is the parabola .
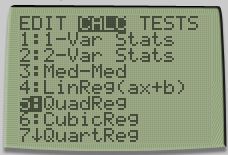
A more modern way of convincing students that the points lie on a parabola is by using technology: specifically, quadratic regression. First, we can input the nine points into a scientific calculator.
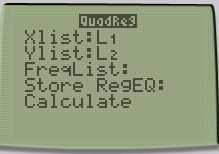
Then we ask the calculator to perform quadratic regression on the data.
The calculator then returns the result:
The best quadratic fit to the data is , or as before. The line indicates a correlation coefficient of 1, meaning that the points lie perfectly on this parabola. A parenthetical note: If the line does not appear using a TI-83 or TI-84, this can be toggled by using DiagnosticOn:
I’ve presented three different ways that algebra students can convince themselves that the nine points generated by the above string art indeed lie on a parabola. I don’t suggest that all three methods should be used for any given student; as always, if one technique doesn’t appear to work pedagogically, then perhaps a different explanation might work.
However, our explorations aren’t done yet. Any of these three techniques may convince algebra students that the strings above trace a parabola. Unfortunately, checking that a statement is true for a few points (in our case, ) does not constitute a complete proof for all points. Furthermore, it’s conceivable that “fuller” string art with additional strings, like the picture below, may identify a new string with a higher coordinate than a colored point.
So we have more work to do to prove our assertion that string art traces a parabola. We begin this next phase of our investigations in the next post.
Recently, I announced that my paper Parabolic Properties from Pieces of String had been published in the magazine Math Horizons. The article had multiple aims; in chronological order of when I first started thinking about them:
Prove that string art from two line segments traces a parabola.
Prove that a quadratic polynomial satisfies the focus-directrix property of a parabola, which is the reverse of the usual logic when students learn conic sections.
Prove the reflective property of parabolas.
Accomplish all of the above without using calculus.
While I’m generally pleased with the final form of the article, the necessity of publication constraints somewhat abbreviated the original goal of this project: determining a pedagogically sound way of convincing a bright Algebra I student that string art unexpectedly produces a parabola. While all the necessary mathematics is in the article, I think the article is somewhat lacking on how to sell the idea to students. So, in this series of posts, I’d like to expand on the article with some pedagogical thoughts about connecting string art to parabolas.
As discussed previous posts, we begin our explorations with string art connecting evenly spaced points on line segments and with endpoints , , and . We will call these colored line segments “strings.” We then found the string with the largest coordinate at , resulting in the following picture:
However, perhaps it’s clearer to plot these points on a separate graph, without the clutter of the strings:
These points are definitely following some kind of curve. In the previous post, we established that the curve is a parabola by using the vertex form of a parabola .
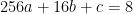
In this post, we use the other general form. If the curve is a parabola, then the equation of the curve must be for some values of , , and . Since there are three unknowns, we need to have three equations to solve for them. This can be done by plugging in three pairs into this equation. While we can pick any three pairs that we wish, it seems convenient to use the points , and :
This simplifies to the system of linear equations
In general systems of linear equations can be challenging for students to solve. However, while this is technically a system, it’s clear that , and so this reduces to a system
or
or
.
In algebra, students are taught multiple ways of solving systems of linear equations, and any of these techniques can be used at this point to solve for and . Perhaps the easiest next step is subtracting the two equations:
Substituting into , we see that
.
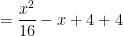
We conclude that , , and , so that, if the points lie on a parabola, the equation of the parabola must be
.
By construction, this parabola passes through , , and . To show that this actually works, we can substitute the other six values of :
At :
At :
At :
At :
At :
At :
Therefore, the nine points in the above picture all lie on the parabola .
In the next post, we’ll discuss a third way of convincing students that the points lie on this parabola.
Recently, I announced that my paper Parabolic Properties from Pieces of String had been published in the magazine Math Horizons. The article had multiple aims; in chronological order of when I first started thinking about them:
Prove that string art from two line segments traces a parabola.
Prove that a quadratic polynomial satisfies the focus-directrix property of a parabola, which is the reverse of the usual logic when students learn conic sections.
Prove the reflective property of parabolas.
Accomplish all of the above without using calculus.
While I’m generally pleased with the final form of the article, the necessity of publication constraints somewhat abbreviated the original goal of this project: determining a pedagogically sound way of convincing a bright Algebra I student that string art unexpectedly produces a parabola. While all the necessary mathematics is in the article, I think the article is somewhat lacking on how to sell the idea to students. So, in this series of posts, I’d like to expand on the article with some pedagogical thoughts about connecting string art to parabolas.
As discussed previous posts, we begin our explorations with string art connecting evenly spaced points on line segments and with endpoints , , and . We will call these colored line segments “strings.” We then found the string with the largest coordinate at , resulting in the following picture:
However, perhaps it’s clearer to plot these points on a separate graph, without the clutter of the strings:
These points are definitely following some kind of curve. Let’s suppose that the curve is a parabola. The vertex form of a parabola is
.
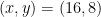
If the curve is a parabola, then clearly the vertex will be the lowest point on the axis of symmetry. By inspection, this point is , which is labeled in the above picture. So, if it’s a parabola, the equation has the form
.
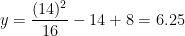
To find the value of , we note that the point must be on the parabola, so that
.
Therefore, the equation of the conjectured parabola is
.
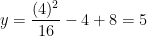
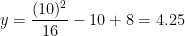
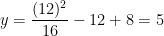
So, if the curve is a parabola, it must follow the function this curve. By construction, this parabola passes through and . To show that this actually works, we can substitute the other seven values of :
At :
At :
At :
At :
At :
At :
At :
Therefore, the nine points in the above picture all lie on the parabola .
In the next couple of posts, we’ll discuss a couple of different ways of establishing that the points lie on this parabola.
Recently, I announced that my paper Parabolic Properties from Pieces of String had been published in the magazine Math Horizons. The article had multiple aims; in chronological order of when I first started thinking about them:
Prove that string art from two line segments traces a parabola.
Prove that a quadratic polynomial satisfies the focus-directrix property of a parabola, which is the reverse of the usual logic when students learn conic sections.
Prove the reflective property of parabolas.
Accomplish all of the above without using calculus.
While I’m generally pleased with the final form of the article, the necessity of publication constraints somewhat abbreviated the original goal of this project: determining a pedagogically sound way of convincing a bright Algebra I student that string art unexpectedly produces a parabola. While all the necessary mathematics is in the article, I think the article is somewhat lacking on how to sell the idea to students. So, in this series of posts, I’d like to expand on the article with some pedagogical thoughts about connecting string art to parabolas.
As discussed in the previous post, we begin our explorations with string art connecting evenly spaced points on line segments and with endpoints , , and . We will call these colored line segments “strings.”
We now ask the following two questions:
For each of $x = 2, 4, 6, 8, 10, 12,$ and , which string has the largest coordinate?
For each of these values of , what is the value of this largest coordinate?
Evidently, for , the brown string that connects to has the largest coordinate. This point is marked with the small brown circle. From the lines on the graph paper, it appears that this brown point is .
For , the horizontal green string appears to have the largest coordinate, and clearly that point is .
For , the pink string that connects to has the largest coordinate. From the lines on the graph paper, it appears that this point is .
Unfortunately, for , , , and , it’s evident which string has the largest coordinate, but it’s not so easy to confidently read off its value. For this example, this could be solved by using finer graph paper with marks at each quarter (instead of at the integers). However, it’s far better to actually use the point-slope formula to find the equation of the colored line segments.
For example, for , the red string has the largest coordinate. This string connects the points and , and so the slope of this string is . Using the point-slope form of a line, the equation of the red string is thus
Substituting , the coordinate of the highest string at is .
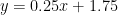
Similarly, at , the equation of the orange string turns out to be , and the coordinate of the highest string at is .
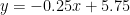
At , the equation of the blue string is , and the coordinate of the highest string at is .
Finally, at , the equation of the purple string is , and the coordinate of the highest string at is .
The interested student could confirm the values for , , and that were found earlier by just looking at the picture.
We now add the coordinates of these points to the picture.
However, perhaps it’s clearer to plot these points on a separate graph, without the clutter of the strings:
These points are definitely following some kind of curve. In the next post in this series, I’ll discuss a way of convincing students that the curve is actually a parabola.
Recently, I announced that my paper Parabolic Properties from Pieces of String had been published in the magazine Math Horizons. The article had multiple aims; in chronological order of when I first started thinking about them:
Prove that string art from two line segments traces a parabola.
Prove that a quadratic polynomial satisfies the focus-directrix property of a parabola, which is the reverse of the usual logic when students learn conic sections.
Prove the reflective property of parabolas.
Accomplish all of the above without using calculus.
While I’m generally pleased with the final form of the article, the necessity of publication constraints somewhat abbreviated the original goal of this project: determining a pedagogically sound way of convincing a bright Algebra I student that string art unexpectedly produces a parabola. While all the necessary mathematics is in the article, I think the article is somewhat lacking on how to sell the idea to students. So, in this series of posts, I’d like to expand on the article with some pedagogical thoughts about connecting string art to parabolas.
To begin, we use graph paper to sketch to draw coordinate axes, the point , the point , the point , line segment , and line segment .
Along , we mark the evenly spaced points , , , , , , and .
Along , we mark the evenly spaced points , , , , , , and .
Next, we draw line segments of different colors to connect:
and
and
and
and
and
and
and
The result should look something like the picture below:
It looks like the string art is tracing a parabola. In this series of posts, I’ll discuss one way that talented algebra students can convince themselves that the curve is indeed a parabola.


 .
. , corresponding to an optimal value of
  (or, more accurately,
  ):
):


 ,
, for a given value of
 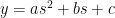 is maximized (for negative
  ) when
  . Therefore, the string with largest
 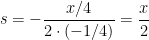 .
. , then string
  has the largest

 ,
, that intersects the parabola
  and
and  with endpoints
  ,
,  , and
, and  . We will call these colored line segments “strings.” We then found the string with the largest
  , resulting in the following picture:
 ) does not constitute a complete proof for all points. Furthermore, it’s conceivable that “fuller” string art with additional strings, like the picture below, may identify a new string with a higher
  and
and  , respectively, the
  and
and  , respectively. For example, if
  , the coordinates of
  and the coordinates of
  , matching the endpoints of the blue string in the first figure.
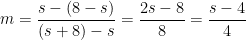 .
.


 , or
, or  indicates a correlation coefficient of 1, meaning that the points lie perfectly on this parabola. A parenthetical note: If the
  line does not appear using a TI-83 or TI-84, this can be toggled by using DiagnosticOn:
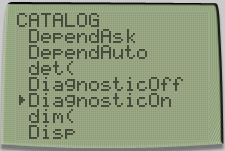

 .
. for some values of
  , and
, and  . Since there are three unknowns, we need to have three equations to solve for them. This can be done by plugging in three
  pairs into this equation. While we can pick any three pairs that we wish, it seems convenient to use the points
  ,
,  and
and  :
:

 system of linear equations

 , and so this reduces to a
  system


 .
.


 .
. ,
,  :
: 
 :
: 
 :
: 
 :
: 
 :
: 
 :
: 
 in the above picture. So, if it’s a parabola, the equation has the form
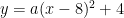 .
. must be on the parabola, so that
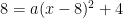


 :
: 

 , which string has the largest
  , the brown string that connects
  to
to  has the largest
  .
. , the horizontal green string appears to have the largest
  , the pink string that connects
  to
to  has the largest
  .
. ,
,  ,
,  , and
, and  , it’s evident which string has the largest
  and
and  , and so the slope of this string is
 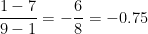 . Using the point-slope form of a line, the equation of the red string is thus


 .
. , and the
  .
. , and the
  .
. , and the
  .
. ,
,  ,
,  ,
,  .
.  ,
,  ,
,  ,
,  .
.