Recently, I announced that my paper Parabolic Properties from Pieces of String had been published in the magazine Math Horizons. The article had multiple aims; in chronological order of when I first started thinking about them:
- Prove that string art from two line segments traces a parabola.
- Prove that a quadratic polynomial satisfies the focus-directrix property of a parabola, which is the reverse of the usual logic when students learn conic sections.
- Prove the reflective property of parabolas.
- Accomplish all of the above without using calculus.
While I’m generally pleased with the final form of the article, the necessity of publication constraints somewhat abbreviated the original goal of this project: determining a pedagogically sound way of convincing a bright Algebra I student that string art unexpectedly produces a parabola. While all the necessary mathematics is in the article, I think the article is somewhat lacking on how to sell the idea to students. So, in this series of posts, I’d like to expand on the article with some pedagogical thoughts about connecting string art to parabolas.

As discussed previous posts, we begin our explorations with string art connecting evenly spaced points on line segments 


However, perhaps it’s clearer to plot these points on a separate graph, without the clutter of the strings:

These points are definitely following some kind of curve. In the previous posts, we established algebraically that the curve is the parabola 
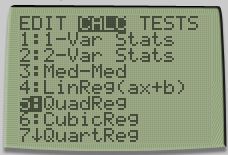
A more modern way of convincing students that the points lie on a parabola is by using technology: specifically, quadratic regression. First, we can input the nine points into a scientific calculator.

Then we ask the calculator to perform quadratic regression on the data.
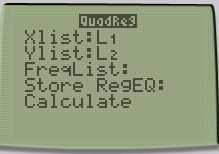
The calculator then returns the result:

The best quadratic fit to the data is 


I’ve presented three different ways that algebra students can convince themselves that the nine points generated by the above string art indeed lie on a parabola. I don’t suggest that all three methods should be used for any given student; as always, if one technique doesn’t appear to work pedagogically, then perhaps a different explanation might work.
However, our explorations aren’t done yet. Any of these three techniques may convince algebra students that the strings above trace a parabola. Unfortunately, checking that a statement is true for a few points (in our case, 

So we have more work to do to prove our assertion that string art traces a parabola. We begin this next phase of our investigations in the next post.

One thought on “Parabolas from String Art (Part 5)”