Meat-A-Morphosis: An Introduction to Functions

The video below was posted by my colleague Jason Ermer, founder of Collaborative Mathematics. From the YouTube description:

A cartoon about the proverbial mathematical “function machine”.

I was part of the creative team of mathematics teachers (including Patty Hill and Michael Word) who created this cartoon. It was originally (and still is) a component of the Honors Algebra 1 curriculum at Kealing Middle School in Austin, Texas.

I take full responsibility for the spelling error. (Can you find it? 🙂

Enjoy.

My Mathematical Magic Show: Part 2c

Last March, on Pi Day (March 14, 2015), I put together a mathematical magic show for the Pi Day festivities at our local library, compiling various tricks that I teach to our future secondary teachers. I was expecting an audience of junior-high and high school students but ended up with an audience of elementary school students (and their parents). Still, I thought that this might be of general interest, and so I’ll present these tricks as well as the explanations for these tricks in this series. From start to finish, this mathematical magic show took me about 50-55 minutes to complete. None of the tricks in this routine are original to me; I learned each of these tricks from somebody else.

green line

For my first trick, I chose the most boring of the routine. Everyone in the audience had a piece of paper and many had calculators. Here is the patter for the first trick:

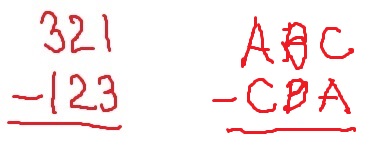
To begin this trick, write down any three-digit number on your piece of paper. Just make sure that the first digit and the last digit are different.

(pause)

Now, reverse the digits and write down a new number. For example, if your number was 321, the new number will be 123.

(pause)

Now, subtract the small number from the big number. If your second number is larger, then put that number on top so that you can subtract the two numbers.

(pause)

Your difference is probably a three-digit number. However, if you ended up with a two-digit number, you can make it a three-digit number by putting a 0 in the hundreds place.

Next, I want you to reverse the digits of the difference to make a new three-digit number. Write this new number under the difference.

(pause)

Finally, add the last two three-digit numbers that you wrote down.

If everyone follows the instructions and does the arithmetic correctly, everyone will get a final answer of 1,089.

The next part of my mathematical magic show is showing everyone why the trick works. Yesterday, I gave an explanation suitable for upper elementary students. Today, I’ll give a more abstract explanation using algebra.

The succinct explanation can be found on Wikipedia:

The spectator’s 3-digit number can be written as 100 × A + 10 × B + 1 × C, and its reversal as 100 × C + 10 × B + 1 × A, where 1 ≤ A ≤ 9, 0 ≤ B ≤ 9 and 1 ≤ C ≤ 9. (For convenience, we assume A > C; if A < C, we first swap A and C.) Their difference is 99 × (AC). Note that if AC is 0 or 1, the difference is 0 or 99, respectively, and we do not get a 3-digit number for the next step.

99 × (A − C) can also be written as 99 × [(A − C) − 1] + 99 = 100 × [(A − C) − 1] − 1 × [(A − C) − 1] + 90 + 9 = 100 × [(A − C) − 1] + 90 + 9 − (A − C) + 1 = 100 × [(A − C) − 1] + 10 × 9 + 1 × [10 − (A − C)]. (The first digit is (A − C) − 1, the second is 9 and the third is 10 − (A − C). As 2 ≤ A − C ≤ 9, both the first and third digits are guaranteed to be single digits.)

Its reversal is 100 × [10 − (A − C)] + 10 × 9 + 1 × [(A − C) − 1]. The sum is thus 101 × [(A − C) − 1] + 20 × 9 + 101 × [10 − (A − C)] = 101 × [(A − C) − 1 + 10 − (A − C)] + 20 × 9 = 101 × [−1 + 10] + 180 = 1089.

However, I don’t particularly care for the succinct explanation, and so I’d prefer to give my audience the following explanation. Let’s write our original three-digit number as ABC, which of course stands for 100 \times A + 10 \times B + C. Then, when I reverse the digits, the new three-digit number will be CBA, or 100 \times C + 10 \times B + A.

1089trick10

Of course, because the first number is bigger than the second number, this means that the first hundreds digit is bigger than the second hundreds digit. This means that the first ones digit has to be less than the second ones digit. In other words, when we subtract, we have to borrow from the tens place. However, the tens digits are the same for both numbers. That means that I have to borrow from the hundreds place also.

I’ll illustrate this for both subtraction problems:

1089trick11
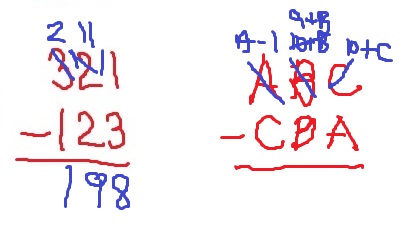
Now I’ll subtract. The hundreds digit will be A - 1 - C. The tens digit will be 9 + B - B, or simply 9. Finally, the ones digit will be 10 + C - A. This is a little hard to write on a board, so I’ll add some dotted lines to separate the hundreds digits from the tens digit from the ones digit:

1089trick12
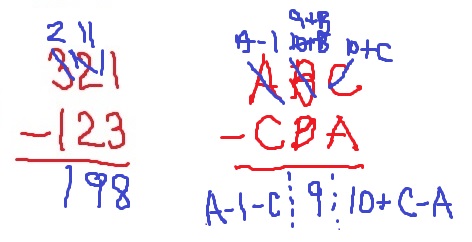
The next step is to reverse the digits and add:

1089trick13I’ll begin with the ones digit:

(10 + C - A) + (A - 1 - C) = 10 - 1 = 9.

No matter what, the ones digit is a 9.
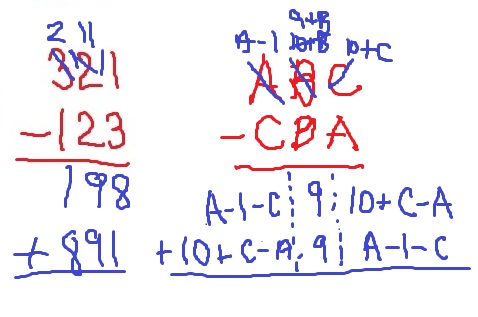
Continuing with the tens digits, I get 9 + 9 = 18. I’ll write down 8 and carry the 1 to the next column.

Finally, adding the hundreds digits (and the extra 1), I get

1 + (A - 1 + C) + (10 + C - A) = 1 - 1 + 10.

Therefore, no matter the values of A, B, and C, the end result must be 1089.

green lineTo complete the routine, I’ll ask a volunteer (usually a young child) to play the magician and repeat the trick for the audience. I consider this an important pedagogical step — the child enjoys being the magician on stage, while the audience lets the routine sink in one more time before I move on to the next magic trick.

Engaging students: Factoring polynomials

In my capstone class for future secondary math teachers, I ask my students to come up with ideas for engaging their students with different topics in the secondary mathematics curriculum. In other words, the point of the assignment was not to devise a full-blown lesson plan on this topic. Instead, I asked my students to think about three different ways of getting their students interested in the topic in the first place.

I plan to share some of the best of these ideas on this blog (after asking my students’ permission, of course).

This student submission again comes from my former student Banner Tuerck. His topic, from Algebra: factoring polynomials.

green line

A1. What interesting (i.e., uncontrived) word problems using this topic can your students do now?

In relation to a specific case one can generate a word problem well within their students reach by relating the factors of a said quadratic polynomial to the length and width of a rectangle or perfect square. Many online resources, such as http://www.purplemath.com/, offer diverse and elaborate examples one could use in order to facilitate this concept. Nevertheless, this way of viewing a factored polynomial may appear more comfortable to a class because it is applying the students preexisting knowledge of area to the new algebraic expressions and equations. Furthermore, it has been my experience that geometric activities interrelating algebra aid in straying students away from ignoring the variable in an expression as a value.

A garden measuring 12 meters by 16 meters is to have a pedestrian pathway installed all around it, increasing the total area to 285 square meters. What will be the width of the pathway?

garden

The above problem is a prime example pulled from the Purple Math website one could use to illustrate a physical situation in which we need to actually determine the factors in order to formulate a quadratic expression to solve for the width. It should be noted that some of these particular word problems can quickly fall into a lesson relating more towards distributing and foiling factors to form an expanded form equation. However, as an instructor one can easily work backwards from an expanded equation to interpret what the factored form can tell us, say about the garden with respect to the example given above.


green line

B1. How can this topic be used in your students’ future courses in mathematics or science?

Factoring polynomials allows students to further comprehend the properties of these expressions before they are later applied as functions in areas such as mathematics and physics. For example, projectile motion stands as a great real world topic capable of enlightening students further on the factors of the polynomial. Specifically, how these factors come about geometrically and how knowing their role will benefit our understanding of the functions potential real world meaning. Lastly, factoring polynomials and evaluating them as roots during middle and high school mathematics will definitely be used when students approach college level calculus courses in relation to indefinite and definite integrals. The previous are just a few examples of how factoring polynomials plays a role in students’ future courses.


green line

How can technology (YouTube, Khan Academy [khanacademy.org], Vi Hart, Geometers Sketchpad, graphing calculators, etc.) be used to effectively engage students with this topic?

Doing a simple YouTube search of the phrase “factoring polynomials” allows anyone access to nearly 57,000 videos of various tutors, instructors, and professors discussing factoring and distributing respectfully. I would say that future generations will definitely not be without resources. That is not even to mention the revolutionary computation website that is www.wolframalpha.com. This website in and of itself will allow so many individuals to see various forms of a factored polynomial, as well as the graph, roots (given from factors), domain, range, etc. Essentially, computation websites like Wolfram Alpha are intended to allow students the opportunity to discover properties, relationships, and patterns independently. However, there is a potential risk for such websites to become a crutch the students use in order to get good grades as opposed to furthering their understanding. Similarly, with the advancing technology of graphing calculators students will become more engaged when discussing polynomial factorization for the first time in class. Many modern calculators have the ability to identify roots, give a table of coordinates, trace graphs, etc. Some even have a LCD screen or a backlit display to aid in viewing various graphs. Although, just as with computation engines, calculators could potentially distract students from thinking about their problem solving method by them just letting the calculator take over the calculation process. Therefore, I would suggest using caution regarding how soon calculators are introduced when initially engaging a class in factoring polynomials.


References:

http://www.purplemath.com/

http://www.purplemath.com/modules/quadprob2.htm

http://www.wolframalpha.com/

https://www.youtube.com/results?search_query=factoring+polynomials


Engaging students: Graphs of linear equations

In my capstone class for future secondary math teachers, I ask my students to come up with ideas for engaging their students with different topics in the secondary mathematics curriculum. In other words, the point of the assignment was not to devise a full-blown lesson plan on this topic. Instead, I asked my students to think about three different ways of getting their students interested in the topic in the first place.

I plan to share some of the best of these ideas on this blog (after asking my students’ permission, of course).

This student submission again comes from my former student Nada Al-Ghussain. Her topic, from Algebra: graphs of linear equations.

green line

How could you as a teacher create an activity or project that involves your topic?

Positive slope, negative slope, no slope, and undefined, are four lines that cross over the coordinate plane. Boring. So how can I engage my students during the topic of graphs of linear equations, when all they can think of is the four images of slope? Simple, I assign a project that brings out the Individuality and creativity of each student. Something to wake up their minds!

An individualized image-graphing project. I would give each student a large coordinate plane, where they will graph their picture using straight lines only. I would ask them to use only points at intersections, but this can change to half points if needed. Then each student will receive an Equation sheet where they will find and write 2 equations for each different type of slope. So a student will have equations for two horizontal lines, vertical lines, positive slope, and negative slope. The best part is the project can be tailored to each class weakness or strength. I can also ask them to write the slop-intercept form, point slope form, or to even compare slopes that are parallel or perpendicular. When they are done, students would have practiced graphing and writing linear equations many times using their drawn images. Some students would be able to recognize slopes easier when they recall this project and their specific work on it.


Example of a project template:


projecttemplate

Examples of student work:

studentwork2


studentwork1


green line

How has this topic appeared in the news?


Millions of people tune in to watch the news daily. Information is poured into our ears and images through our eyes. We cannot absorb it all, so the news makes it easy for us to understand and uses graphs of linear equations. Plus, the Whoa! Factor of the slopping lines is really the attention grabber. News comes in many forms either through, TV, Internet, or newspaper. Students can learn to quickly understand the meaning of graphs with the different slopes the few seconds they are exposed to them.


On television, FOX news shows a positive slope of increasing number of job losses through a few years. (Beware for misrepresented data!)

graph1

A journal article contains the cost of college increase between public and private colleges showing the negative slope of private costs decreasing.

graph2

Most importantly line graphs can help muggles, half bloods, witches, and wizards to better understand the rise and decline of attractive characters through the Harry Potter series.

graph3

green line

How can this topic be used in your students’ future courses in mathematics or science?


Students are introduced to simple graphs of linear equations where they should be able to name and find the equation of the slope. In a student’s future course with computers or tablets, I would use the Desmos graphing calculator online. This tool gives the students the ability to work backwards. I would ask a class to make certain lines, and they will have to come up with the equation with only their knowledge from previous class. It would really help the students understand the reason behind a negative slope and positive slope plus the difference between zero slope and undefined. After checking their previous knowledge, students can make visual representations of graphing linear inequalities and apply them to real-world problems.


References:

http://www.hoppeninjamath.com/teacherblog/?p=217

http://walkinginmathland.weebly.com/teaching-math-blog/animal-project-graphing-linear-lines-and-stating-equations

http://mediamatters.org/research/2012/10/01/a-history-of-dishonest-fox-charts/190225

http://money.cnn.com/2010/10/28/pf/college/college_tuition/

http://dailyfig.figment.com/2011/07/13/harry-potter-in-charts/

https://www.desmos.com/calculator


Engaging students: Completing the square

In my capstone class for future secondary math teachers, I ask my students to come up with ideas for engaging their students with different topics in the secondary mathematics curriculum. In other words, the point of the assignment was not to devise a full-blown lesson plan on this topic. Instead, I asked my students to think about three different ways of getting their students interested in the topic in the first place.

I plan to share some of the best of these ideas on this blog (after asking my students’ permission, of course).

This student submission again comes from my former student Tracy Leeper. Her topic, from Algebra: completing the square.

green line

What interesting things can you say about the people who contributed to the discovery and/or the development of this topic?

Muhammad ibn Musa al-Khwarizmi wrote a book called al-jabr in approximately 825 A.D. He was in Babylon and he worked as a scholar at the House of Wisdom. Al-Khwarizmi had already mastered Euclid’s Elements, which is the foundation for Geometry. So in his book he posed the challenge “What must be the square which, when increased by ten of its own roots; amounts to 39?” or in other words: how to solve he turned to geometry and drew a picture to figure out the answer. By doing so, al-Khwarizmi found out how to solve equations by completing the square. He also included instructions on how he solved the problem in words. His book al-jabr become the foundation for our modern day algebra. The Arabic word al-jabr was translated into Latin to give us algebra, and our word for algorithm came from al-Khwarizmi, if you can believe it. Later on, his work was used by other Arab and Renaissance Italian mathematicians to “complete the cube” for solving cubic equations.


green line

How does this topic extend what your students should have learned in previous courses?

In previous courses my students should have already been introduced to prime factorization, the quadratic formula, parabolas, coordinates graphs and other similar topics. Completing the square is another way for students to find the roots of a quadratic equation. The first way taught is by using nice numbers that will factor easily. Then the math progresses to using the quadratic equation for the numbers that don’t factor easily. Completing the square is just another way to solve a quadratic that does not easily factor. Some students prefer to go straight to the quadratic equation, whereas other students will favor completing the square after they learn how to do it. It gives the students another “tool” for their toolbox on how to solve equations, and will enable them to solve equations that previously were unsolvable, such as the quadratic . By giving students a variety of ways to solve a problem, they can pick whichever way they are most comfortable with, which in turn will boost their confidence in their ability to learn math.


green line

How could you as a teacher create an activity or project that involves your topic?

Usually the simplest way to learn something is to see something concrete of what you are trying to do. For completing the square, I can give the students the procedure to follow, but they probably won’t be able to fully understand why it works. In order to help them visualize it, I would use algebra tiles. One long tile is equal to x, since its length is x and its width is 1. The square is equal to since the length and the width are both equal to x. However, when you try to add to the square by a factor of x, you end up having a corner missing. This is the part that is missing from the initial equation. Then the students see that you don’t have a complete square, but by adding the same amount to both parts, we can get a complete square that can then be factored. Like so…

References:

http://bulldog2.redlands.edu/fac/beery/math115/m115_activ_complsq.htm

http://www.youtube.com/watch?v=JXrj5Dtgpss


Engaging students: Factoring quadratic polynomials

In my capstone class for future secondary math teachers, I ask my students to come up with ideas for engaging their students with different topics in the secondary mathematics curriculum. In other words, the point of the assignment was not to devise a full-blown lesson plan on this topic. Instead, I asked my students to think about three different ways of getting their students interested in the topic in the first place.

I plan to share some of the best of these ideas on this blog (after asking my students’ permission, of course).

This student submission again comes from my former student Kristin Ambrose. Her topic, from Algebra: factoring quadratic polynomials.

green line

In previous courses, students would have learned how to solve one-variable linear equations. These kinds of equations would involve variables to the power of one. Quadratic equations extend from this since they add a variable to the equation that is to the power of two. Since students learned how to solve linear equations, they may be curious as to how they can solve quadratic equations that extend from this. Factoring is a way for students to solve these kinds of equations.

Also, in previous courses students would have learned about the ‘factors’ of a number. When talking about numbers, the factors are the numbers you multiply to get another number. For example the positive factors of six are one and six, and two and three. Factoring quadratic polynomials follows this logic, except instead finding the factors of a number, students are finding the factors of an expression. For example, the factors of the expression x^2+4x+3 are (x+3) and (x+1). Just like how when we multiply two times three we get six, when we multiply (x+3) times (x+1) we get the expression x^2+4x+3.


green line

How has this topic appeared in pop culture (movies, TV, current music, video games, etc.)?


There is a popular video game called Angry Birds in which the user launches birds to try and knock down structures built by pigs. This game relates to factoring quadratics because if we were to plot the trajectory of the birds being launched on a graph, the result would be a parabola, in other words the graph of a quadratic function. Factoring quadratic polynomials is a way to find the solutions of a quadratic, and the solutions are where the parabola crosses the x-axis. In Angry Birds, we could set our x-axis to be the ground, and our solutions would correspond with where on the ground the bird would land, if nothing were to block its path. If students were given the quadratic equation for the parabola corresponding with the bird’s trajectory, students would be able to factor the equation to solve for where on the ground the bird would land.


green line

What are the contributions of various cultures to this topic?


Indian and Islamic cultures are two major cultures that have contributed to the topic of factoring quadratic polynomials. In Islamic culture, Al-Khwarizmi contributed to this topic by creating a way to solve quadratic equations by reducing the equations to one of six forms, which were then solvable. He described these forms in terms of squares, roots, and numbers, much like the terms we use today when factoring quadratic polynomials. The ‘squares’ related to what would today be our ‘x2’ term, the ‘roots’ related to the ‘x’ term, and the ‘numbers’ to the ‘c’ constant term. One of the forms he described was “squares and roots equal numbers,” in modern terms, “ax2 + bx = c.” Today, we factor quadratic polynomials of the form “ax2 + bx + c” which is similar to the form Al-Khwarizmi described. (Islamic Mathematics – Al-Khwarizmi)

In Indian culture, Brahmagupta contributed to the concept of factoring quadratics by introducing the idea that a number could be negative. This was significant because it meant a number like 9 could be factored into 32 or (-3)2. Since a number could have a negative factor, it followed that quadratic equations could have two possible solutions, since one solution could be negative. Factoring quadratic polynomials like we do today would be impossible without the knowledge that quadratic expressions can have two solutions. (Indian Mathematics – Brahmagupta)


References:


“Islamic Mathematics – Al-Khwarizmi.” The Story of Mathematics. 2010. Web. 17 Sept. 2014. <http://www.storyofmathematics.com/islamic_alkhwarizmi.html&gt;.


“Indian Mathematics – Brahmagupta.” The Story of Mathematics. 2010. Web. 17 Sept. 2014. <http://www.storyofmathematics.com/indian_brahmagupta.html&gt;.


Engaging students: Slope-intercept form of a line

In my capstone class for future secondary math teachers, I ask my students to come up with ideas for engaging their students with different topics in the secondary mathematics curriculum. In other words, the point of the assignment was not to devise a full-blown lesson plan on this topic. Instead, I asked my students to think about three different ways of getting their students interested in the topic in the first place.

I plan to share some of the best of these ideas on this blog (after asking my students’ permission, of course).

This student submission again comes from my former student Kelley Nguyen. Her topic, from Algebra: slope-intercept form of a line.

green line

How has this topic appeared in high culture (art, classical music, theatre, etc.)?


The slope-intercept form of a line is a linear function. Linear functions are dealt with in many ways in everyday life, some of which you probably don’t even notice.


One example where the slope-intercept form of a line appears in high culture is through music and arts. Suppose a band wants to book an auditorium for their upcoming concert. As most bands do, they meet with the manager of the location, book a date, and determine a payment. Let’s say it costs $1,500 to rent the building for 2 hours. In addition to this fee, the band earns 20% of each $30 ticket sold. Write an equation that determines whether the band made profit or lost money due to the number of tickets sold – the equation would be y = 0.2(30)x – 1500, where y is the amount gained or lost and x is the number of tickets sold that night. This can also help the band determine their goal on how many tickets to sell. If they want to make a profit of $2,000, they would have to sell x-many tickets to accomplish that.


In reality, most arts performances make a profit from their shows or concerts. Not only do mathematicians and scientists use slope-intercept of a line, but with this example, it shows up in many types of arts and real-world situations. Not only does the form work for calculating cost or profit, it can relate to the number of seats in a theatre, such as x rows of 30 seats and a VIP section of 20 seats. The equation to find how many seats are available in the theatre is y = 30x + 20, where x is the number of rows.


green line

How can technology be used to effectively engage students with this topic?


A great way to engage students when learning about slope-intercept form of a line is to use Geometer’s Sketchpad. After opening a graph with an x- and y-axis, use the tools to create a line. From there, you can drag the line up or down and notice that the slope increases as you move upward and decreases as you move downward. Students can also find the equation of the line by selecting the line, clicking “Measure” in the menu bar, and selecting “Equation” in the drop-down list. This gives the students an accurate equation of the line they selected in slope-intercept form. Geometer’s Sketchpad allows students to experiment and explore directions of lines, determine whether or not it has an increasing slope, and help create a visual image for positive and negative slopes.


Also, with this program, students can play a matching game with slope-intercept equations and lines. You will instruct the student to create five random lines that move in any direction. Next, they will select all of the lines, go to “Measure” in the menu bar, and click “Equation.” From there, it’ll give them the equation of each line. Then, the student will go back and select the lines once again, go to “Edit” on the menu bar, hover over “Action Buttons,” and select “Hide/Show.” Once a box comes up, they will click the “Label” tab and type Scramble Lines in the text line. Next, the lines will scramble and stop when clicked on. Once the lines are done scrambling, the student could then match the equations with their lines. This activity gives the students the chance to look at equations and determine whether the slope is increasing and decreasing and where the line hits the y-axis.


green line

How could you as a teacher create an activity or project that involves your topic?


With this topic, I could definitely do a project that consists of slope-intercept equations, their graphs, and word problems that involve computations. For example, growing up, some students had to earn money by doing chores around the house. Parents give allowance on daily duties that their children did.


The project will give the daily amount of allowance that each student earned. With that, say the student needed to reach a certain amount of money before purchasing the iPad Air. In part one of the project, the student will create an equation that reflects their daily allowing of $5 and the amount of money they have at the moment. In part two, the student will construct a graph that shows the rate of their earnings, supposing that they don’t skip a day of chores. In part three, the students will answer a series of questions, such as,

  • What will you earn after a week?
  • What is your total amount of money after that week?
  • When will you have enough money to buy that iPad Air at $540 after tax?


This would be a short project, but it’s definitely something that the students can do outside of class as a fun activity. It can also help them reach their goals of owning something they want and making a financial plan on how to accomplish that.


References


Engaging students: Word problems involving inequalities

In my capstone class for future secondary math teachers, I ask my students to come up with ideas for engaging their students with different topics in the secondary mathematics curriculum. In other words, the point of the assignment was not to devise a full-blown lesson plan on this topic. Instead, I asked my students to think about three different ways of getting their students interested in the topic in the first place.

I plan to share some of the best of these ideas on this blog (after asking my students’ permission, of course).

This student submission again comes from my former student Emily Bruce. Her topic, from Algebra: word problems involving inequalities.

green line

How could you as a teacher create an activity or project that involves your topic?

Everyone learns in different ways. There are three common learning types, which are auditory, visual, and kinesthetic. The best activities and lesson plans involve all three of these learning styles. A great way to involve all of these learning styles is to use objects that students can rearrange and manipulate with their hands. When learning about inequality word problems, I would have print large numbers and symbols on pieces of paper that they could tape to a whiteboard. In groups, they would be able to rearrange their numbers and inequality symbols as they are working through a word problem, until the figure out the correct inequality. Then as a class, we could discuss their answers. This addresses the auditory, by discussing, the visual, by them seeing the inequalities as they read them, and the kinesthetic learners, by being able to manipulate it using their hands.


green line

What are the contributions of various cultures to this topic?

The strict inequality symbols (less than and greater than) were originally seen in 1631, when used by British mathematician, Thomas Harriot. Some believe that his inspiration for these symbols came from a symbol that he saw on the arm of a Native American. The symbol he saw looked like the strict inequality symbols overlapping. The bars for the unstrict inequalities (less than or equal to and greater than or equal to) were not added until much later. It wasn’t until almost 40 years later, in 1670, that John Wallis started putting a line above the strict inequality symbols. Almost 65 years after that, in 1734, French mathematician, Pierre Bouguer, began writing a double line underneath the inequality symbols.


http://jeff560.tripod.com/relation.html

http://en.wikipedia.org/wiki/Table_of_mathematical_symbols_by_introduction_date


green line

How can technology be used to effectively engage students with this topic?

Quizlet.com is a website that can be used as a good review for many topics. When exploring the section on inequality word problems, I found many useful and engaging things that would help students review and study the material. There were flash cards with word problems on one side and the corresponding equations on the flip side. There was also a test that they could take after studying the material, in order to examine their progress. Lastly, the website had two games that involve solving inequality word problems. This is a great way for students to study and review material. The website is not only great for inequality word problems, but topics of all kinds, in all subjects.


Engaging students: Approximating data by a straight line

In my capstone class for future secondary math teachers, I ask my students to come up with ideas for engaging their students with different topics in the secondary mathematics curriculum. In other words, the point of the assignment was not to devise a full-blown lesson plan on this topic. Instead, I asked my students to think about three different ways of getting their students interested in the topic in the first place.

I plan to share some of the best of these ideas on this blog (after asking my students’ permission, of course).

This student submission again comes from my former student Delaina Bazaldua. Her topic, from Algebra: approximating data to a straight line.

green line

How has this topic appeared in pop culture (movies, TV, current music, video games, etc.)?

One of my favorite shows to watch is How I Met Your Mother. I specifically chose this topic for this class because of how it relates to an episode of the show. A piece of the episode that I’m referring to is shown in the YouTube video:

Barney, one of the main characters, describes the graph as the Crazy/Hot Scale. According to him, a girl cannot be crazier than hot which means she has to be above the diagonal straight line. This relates to the topic because one can approximate data by the straight line that Barney gives the viewer. I think the students will be able to relate to this and also find it humorous. Because this video has both of these characteristics, they will be able to remember the concept for upcoming homework and tests which is ultimately the most important part of math: understanding it and being able to recall it.


green line

How has this topic appeared in the news?

Most lines are drawn for the purpose of seeing if there is a relationship between the x and y axis and trying to figure out if you can approximate data from the straight line that is drawn. Graphs like this are found all over the news, and they often relate to natural disasters. For example, this linear regression, http://d32ogoqmya1dw8.cloudfront.net/images/quantskills/methods/quantlit/bestfit_line.v2.jpg, describes floods. In http://serc.carleton.edu/mathyouneed/graphing/bestfit.html, where the picture is found, describes more activities that can be used to create a linear regression which can be converted into a straight line. These examples of straight lines can be used to find more data that isn’t necessarily shown from the points that are plotted. The examples the website gave are: flood frequency curves, earthquake forecasting, meteorite impact prediction, earthquake frequency vs. magnitude, and climate change. This is beneficial for math because it allows students to realize that math isn’t abstract like it is often perceived to be, but rather, it is used for something very important and something that occurs several times a year such as natural disasters and weather.


green line

How can this topic be used in your students’ future courses in mathematics or science?

One of the purposes for teachers to teach is for students to learn what they should for the following year so they can be successful in the particular topic. When it comes to approximating data based on a straight line, the knowledge a student learns in algebra will carry them through statistics, physics, and other higher math and science classes. Linear regression is shown in statistics as one can see in this statistics website: http://onlinestatbook.com/2/regression/intro.html while physics is represented in the physics website: http://dev.physicslab.org/Document.aspx?doctype=3&filename=IntroductoryMathematics_DataAnalysisMethods.xml. A lot can be predicted from these straight lines which is why these graphs aren’t foreign to upper level math and science classes. As I stated before, a lot can be predicted from the graph where data points aren’t necessarily on the trend the data is setting which allows students to expect what would occur at a particular x or y value. A background in this area can help students through the rest of school and perhaps even the rest of their life in some cases.


References:

https://www.youtube.com/watch?v=uN_sSXKbzHk

http://serc.carleton.edu/mathyouneed/graphing/bestfit.html

http://onlinestatbook.com/2/regression/intro.html

http://dev.physicslab.org/Document.aspx?doctype=3&filename=IntroductoryMathematics_DataAnalysisMethods.xml


Engaging students: The quadratic formula

In my capstone class for future secondary math teachers, I ask my students to come up with ideas for engaging their students with different topics in the secondary mathematics curriculum. In other words, the point of the assignment was not to devise a full-blown lesson plan on this topic. Instead, I asked my students to think about three different ways of getting their students interested in the topic in the first place.

I plan to share some of the best of these ideas on this blog (after asking my students’ permission, of course).

This student submission again comes from my former student Chais Price. His topic, from Algebra: the quadratic formula.

green line

What interesting things can you say about the people who contributed to the discovery and/or the development of this topic?

What is the quadratic formula you ask? It is basically a tool used to find roots of the quadratic equation. It all started around 3000 BC,when the Ancient Babylonians needed a method for calculating how much to pay the tax collector. Imagine that you are an Ancient Babylonian farmer with a square field that is placed in the middle of your farm. On this field you plan to plant some crops. After some experimenting you discover that if you double the length of each side of the square field, you end up with 4 times as many crops as before. This observation demonstrated the area of the field and the amount of crops that you can grow and the square of one of the side lengths are all proportional. From here we come up with the first quadratic equation. Let “x” represent the length of a side and “m” be the amount of crops you can grow on a square field of side length 1. Then we have “c” which is the entire area of crop that can be grown. Thus c= mx^2. It is now April 15 in Babylonia and the tax collector comes and says to give him “c” crops to pay your taxes. Now you ask yourself, how big does your square field need to be to grow that amount of crops? Well as it turns out, we just take x= (c/m)^1/2. The Babylonians however, did not have a way to solve square roots accurately. They were just estimations. This square field representation is just a basic representation. Let’s say that your field was not a square but a triangle divided into 2 right triangles where a and b are the amount of crops that you can grow in each field.

triangle

To calculate the amount of crops, you being a very intelligent Babylonian farmer, you come up with the equation

c= ax^2+bx.

The next step is to divide by “a” and then complete the square yielding

a \displaystyle \left(x + \frac{b}{2a} \right)^2 = x^2 + \displaystyle \frac{b}{a}x + \displaystyle \frac{b^2}{4a^2}

Now we substitute into the previous equation. We now have an equation of the form

a \displaystyle\left( x + \frac{b}{2a} \right)^2 = c + \displaystyle \frac{b^2}{4a^2}

Solving again for the tax collector, we need to solve for “x.” This gives us what we know as the quadratic formula:

x = \displaystyle \frac{-b \pm \sqrt{b^2 + 4ac}}{2a}

Something worth noting since you are an Ancient Babylonian farmer, is that all the roots you find are positive since negative numbers have not been discovered yet. In addition, the quadratic formula shown above is just an illustration broken down step by step. The Babylonians had no general formula for the quadratic formula, but there method for the quadratic formula can be closely associated with the method of completing the square.

green line

How has this topic appeared in the news?

There is a pretty interesting article I read which had to do with the quadratic equation. A teacher provided a list of quadratic equations that the students would pick from. This equation was to be to model for a parabolic device that the student was responsible for building. The student was instructed to spend no more than 12 dollars on this project. They would use the equation to calculate a positional focus which suspended a marshmallow which would cook slowly due to the rays of the sun reflected upon it. This lesson stretched using a quadratic equation to form a focus. Then the student would graph the data and calculate the rate of temperature increase. Student were also asked to make predictions on what temperature the marshmallow would get to. Once the experiment is complete, the student is anxious to see how accurate their model is to the actual equation they chose. This is a very good lesson that covers a pretty broad range of topics.

green line

So the concept of the quadratic formula would develop beyond what the Ancient Babylonians discovered. 1500 years after the Babylonians, the Egyptians came along with a different approach for similar type problems where the quadratic formula was used. The mathematics behind the calculations were known to be very complicated. However, they recorded these calculation on a table ( much like our multiplication tables) so that when a farmer or an engineer required some kind of proportion or dimensional measurement using the quadratic formula, rather than solving the problem again, they would just look it up on the table that had already been calculated. They reproduced this table and made it a master look up guide to follow for such solutions.

Then the Babylonians would reappear in time and discover the method of completing the square. This method still required somewhat of an educated guess. However, since the Babylonians had a 60 base numerical system ( which the Egyptians did not) addition and multiplication were easier to compute and check calculations. Even still there was not a general formula or equation established. Then Pythagoras and Euclid came along and developed a general formula to solve the quadratic equation. Pythagoras argued that the ratio of the area of a square and the length of a side does not always produce an integer and indeed can have a rational solution. Euclid advanced beyond Pythagoras and claimed you could have irrational results. These were logical claims made from a theoretical point of view because at that time there was no way to calculate the square root of a number by hand. Finally in 700 AD, a mathematician named Brahmagupta from India came up with a general solution to the quadratic equation using numbers. He also was on board with Euclid and his irrationals as well as an equation producing 2 roots. His work more than likely inspired another Hindu Mathematician named Baskhara who around 1100 AD formulated the complete solution we are familiar with today. He was also the first to acknowledge that any number greater than 0 has 2 square roots. It was around this same time in history that a Jewish mathematician Abraham bar Hiyya derived the quadratic formula and brought it to Europe. It wouldn’t be until another 500 years that the quadratic formula would be adopted into the formula we know today.


Works Cited


Budd, Chris, and Chris Sangwin. “101 Uses of the Quadratic Equation.” Plus Math. Plus Magazine… Living Mathematics , 01 Mar 2004. Web. 10 Sep 2014. http://plus.maths.org/content/101-uses-quadratic-equation

Tracey, Wong Briggs. “Students use quadratic equations to cook marshmallows.” USA Today. USA Today, 05 Mar 2007. Web. 10 Sep 2014. http://usatoday30.usatoday.com/news/education/2007-03-04-teacher-parabola-side_N.htm?csp=34

Hell, Dr. . “The History Behind the Quadratic Formula .” . BBC H2G2, 13 October 2004. Web. 10 Sep 2014. http://news.bbc.co.uk/dna/place-lancashire/plain/A2982567