In my capstone class for future secondary math teachers, I ask my students to come up with ideas for engaging their students with different topics in the secondary mathematics curriculum. In other words, the point of the assignment was not to devise a full-blown lesson plan on this topic. Instead, I asked my students to think about three different ways of getting their students interested in the topic in the first place.
I plan to share some of the best of these ideas on this blog (after asking my students’ permission, of course).
This student submission comes from my former student Irene Ogeto. Her topic, from Precalculus: graphing exponential growth and decay functions.

How can technology (YouTube, Khan Academy [khanacademy.org], Vi Hart, Geometers Sketchpad, graphing calculators, etc.) be used to effectively engage students with this topic? Note: It’s not enough to say “such-and-such is a great website”; you need to explain in some detail why it’s a great website.
The Legend of the Chessboard is a famous legend that illustrates exponential growth. A courtier presented a Persian king with the chessboard and as a reward the courtier asked the king for a grain of rice in each square of the chessboard, doubling the amount in each new square. The king agreed and gave the courtier 1 grain of rice in the first square, 2 grains of rice in the second, four grains of rice in the third and so on. The king didn’t realize how rapidly the amount of grain of rice would grow in each square. This video would be a great way to engage the students into the topic at the beginning of the lesson. The Legend of the Chessboard shows how rapidly exponential functions can grow. After watching the video the students can try to guess or calculate the total number of grains of rice the courtier would get in the end. Afterwards, the students can then graph the exponential function.
The students can use this website to check their guess:
http://britton.disted.camosun.bc.ca/jbchessgrain.htm
How could you as a teacher create an activity or project that involves your topic?
In order to explore graphing exponential growth and decay functions, the students could play a card sort matching game. The students will work in groups to play the card sort matching game. Some students will be given the graphs and have to use the points given to derive the equation. Some groups will be given the equations and have to create the graphs of the exponential functions. As a class, we will go over graphing exponential growth and decay functions and analyze the graphs. The students will be expected to identify the domain, range, asymptotes, y-intercepts and whether the graph is exponential growth or exponential decay. Also, we could explore how exponential functions compare to other functions that we previously studied. This is a great activity that can be used as review before an exam.
How can this topic be used in your students’ future courses in mathematics or science?
Exponential functions are used to model different real world scenarios involving population, money, finances, bacteria and much more. Students can use exponential functions in other courses such as Calculus, Biology, Chemistry, Physics, and Economics. In calculus, students explore differentiation and integration of exponential functions. Given the position of an object in exponential form, students can use Calculus to determine if the object will stop moving. Newton’s Law of Cooling is an example in physics that demonstrates exponential decay. Compound interest is a major application of exponential functions in finances. Exponential population growth, carbon dating, pH and concentrations of drugs are other examples in math and science that can be modeled by exponential growth and decay functions. In addition, students explore logarithmic functions, the inverses of exponential functions. Being able to recognize and graph exponential growth and decay functions is an important concept that can help students’ in their future courses in math or science.
References:
https://www.youtube.com/watch?v=t3d0Y-JpRRg

 is cut from a corner of a square of side
  . By cutting the remaining figure in two and rearranging the pieces, a rectangle with side lengths of
  and
and  can be formed, thus proving that
 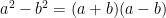 .
.


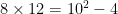
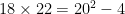
 ,
, without pulling out their calculators.


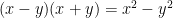
 ,
,


 .
.


 ,
, .
.


