Recently, I announced that my paper Parabolic Properties from Pieces of String had been published in the magazine Math Horizons. The article had multiple aims; in chronological order of when I first started thinking about them:
- Prove that string art from two line segments traces a parabola.
- Prove that a quadratic polynomial satisfies the focus-directrix property of a parabola, which is the reverse of the usual logic when students learn conic sections.
- Prove the reflective property of parabolas.
- Accomplish all of the above without using calculus.
While I’m generally pleased with the final form of the article, the necessity of publication constraints somewhat abbreviated the original goal of this project: determining a pedagogically sound way of convincing a bright Algebra I student that string art unexpectedly produces a parabola. While all the necessary mathematics is in the article, I think the article is somewhat lacking on how to sell the idea to students. So, in this series of posts, I’d like to expand on the article with some pedagogical thoughts about connecting string art to parabolas.

As discussed previous posts, we begin our explorations with string art connecting evenly spaced points on line segments 


However, perhaps it’s clearer to plot these points on a separate graph, without the clutter of the strings:

These points are definitely following some kind of curve. In the previous post, we established that the curve is a parabola by using the vertex form of a parabola 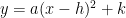
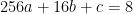
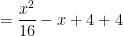
In this post, we use the other general form. If the curve is a parabola, then the equation of the curve must be 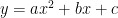


This simplifies to the 

In general 


or


or


In algebra, students are taught multiple ways of solving

Substituting into


We conclude that 


By construction, this parabola passes through 
At 

At 
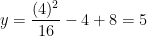
At 

At 
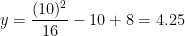
At 
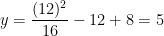
At 
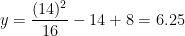
Therefore, the nine points in the above picture all lie on the parabola
In the next post, we’ll discuss a third way of convincing students that the points lie on this parabola.
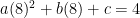
 in the above picture. So, if it’s a parabola, the equation has the form
 .
. must be on the parabola, so that


 .
. :
: 

 , which string has the largest
  , the brown string that connects
  to
to  has the largest
  .
. , the horizontal green string appears to have the largest
  , the pink string that connects
  to
to  has the largest
  .
. ,
,  ,
,  , and
, and  , it’s evident which string has the largest
  and
and  , and so the slope of this string is
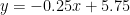
 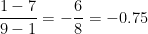 . Using the point-slope form of a line, the equation of the red string is thus


 .
. , and the
  .
. , and the
  .
. , and the
  .
. ,
,  ,
,  ,
,  .
.  ,
,  ,
,  ,
,  .
.