Engaging students: Graphing an ellipse

In my capstone class for future secondary math teachers, I ask my students to come up with ideas for engaging their students with different topics in the secondary mathematics curriculum. In other words, the point of the assignment was not to devise a full-blown lesson plan on this topic. Instead, I asked my students to think about three different ways of getting their students interested in the topic in the first place.

I plan to share some of the best of these ideas on this blog (after asking my students’ permission, of course).

This student submission comes from my former student Samantha Smith. Her topic, from Precalculus: graphing an ellipse.

green line

How has this topic appeared in pop culture?

Football is America’s favorite sport. There is practically a holiday for it: Super Bowl Sunday. I do not think students realize how much math is actually involved in the game of football, from statistics, to yards, the stadium and even the football itself. The video link below explores the shape of the football and of what importance the shape is. As you can see in the picture below, a 2D look of the football shows us that it is in the shape of an ellipse.


The video further explains how the 3D shape (Prolate Spheroid) spins in the air and is aerodynamic. Also, since it is not spherical, it is very unpredictable when it hits the ground. The football can easily change directions at a moments notice. This video is a really cool introduction to graphing an ellipse; it shows what the shape does in the real world. Students could even figure out a graph to represent a football. Overall, this is just a way to engage students in something that they are interested in.

football

https://www.nbclearn.com/nfl/cuecard/50824 (Geometric Shapes –Spheres, Ellipses, & Prolate Speroids)


green line

D. History: What interesting things can you say about the people who contributed to the discovery and/or development of this topic?

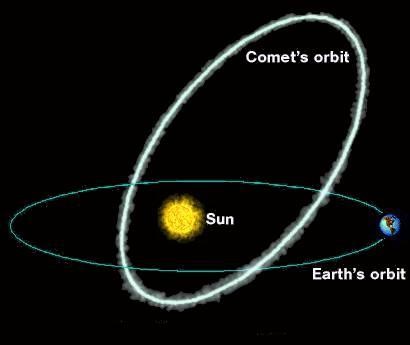
Halley’s Comet has been observed since at least 240 B.C. It could be labeled as the most well-known comet. The comet is named after one of Isaac Newton’ friends, Edmond Halley. Halley worked closely with Newton and used Newton’s laws to calculate how gravitational fields effected comets. Up until this point in history, it was believed that comets traveled in a straight path, passing the Earth only once. Halley discovered that a comet observed in 1682 followed the same path as a comet observed in 1607 and 1531. He predicted the comet would return in 76 years, and it did. Halley’s Comet was last seen in 1986 so, according to Halley’s calculations, it will reappear in 2061.
Halley’s Comet has an elliptical orbit around the sun. It gets as close to the sun as the Earth and as far away from the sun as Pluto. This is an example of how ellipses appear in nature. We could also look at the elliptical orbits of the different planets around the sun. Students have grown up hearing about Newton’s Laws, but this is an actual event that supported and developed those laws in relation to ellipses.

What is Halley’s Comet?

halley


green line

How has this topic appeared in high culture?

whisperinggallery

Through my research on ellipses, the coolest application I found is Statuary Hall (the Whispering Gallery) in our nation’s capital. The Hall was constructed in the shape of an ellipse. It is said that if you stand at one focal point of the ellipse, you can hear someone whispering across the room at the other focal point because of the acoustical properties of the elliptical shape. The YouTube video below illustrates this phenomena. The gallery used to be a meeting place of the House of Representatives. According to legend, it was John Quincy Adams that discovered the room’s sound properties. He placed his desk at a focus so he could easily hear conversations across the room.

The first link below is a problem students can work out after transitioning from the story of the hall. Given the dimensions of the room, students find the equation of the ellipse that models the room, the foci of the ellipse, and the area of the ellipse. This one topic can cover multiple applications of the elliptical form of Statuary Hall.

Click to access PreAP-PreCal-Log-6.3.pdf

http://www.pleacher.com/mp/mlessons/calculus/appellip.html

Engaging students: Graphing a hyperbola

In my capstone class for future secondary math teachers, I ask my students to come up with ideas for engaging their students with different topics in the secondary mathematics curriculum. In other words, the point of the assignment was not to devise a full-blown lesson plan on this topic. Instead, I asked my students to think about three different ways of getting their students interested in the topic in the first place.

I plan to share some of the best of these ideas on this blog (after asking my students’ permission, of course).

This student submission comes from my former student Rebekah Bennett. Her topic, from Precalculus: graphing a hyperbola.

green line

Hyperbolas are one of the hardest things to find within the real world. Relating to students, the hyperbola is popularly known as the Hurley symbol; A widely known surf symbol that is now branded on clothes and surf boards. It is also used widely in designs to create patterns on large carpets or flooring. They can also be used when building houses to make sure that a curve on the exterior or interior of the house is mirrored exactly how the buyer wants. Hyperbolas can be found when building graphics for games such as the game roller coaster tycoon. This is a game where several different graphics must be formed so that any type of roller coaster can be created. Also, when playing the wii or xbox Kinect, hyperbolas are used within the design of the system. Since both game systems are based on movement and there are several different types of ways someone can move, the system must have these resources available so that it can read what the person in doing. Hyperbolas are commonly found everywhere with some type of design.


green line

To explore this topic, I would first show the students this video of the roller coaster “Fire and Ice” which is in Orlando, Florida at Universal Studios. This roller coaster was created so that when the two roller coasters go around a loop at the same time, they will never hit, making for a fun, adventurous time. This is what a hyperbola simply is; every point lies within the same ratio from focus to directrix. During the video point out the hyperbolic part of the roller coaster which is shown at the 49-51 second mark.


Now after watching the video, the students would be given about 8 minutes to explore by themselves or with a partner, how to create their own hyperbola. The student can use any resources he/she would like. Once the students have had enough time to explore, the teacher would then have the student watch an instructional video from Kahn Academy.


The video is very useful in teaching students how to graph a hyperbola because the instructor goes through step by step carefully explaining what each part means and why each part is placed where it is in the function. The video is engaging to the students since they don’t have to listen to their teacher say it a million times and then reinforce it. This is also helpful for the teacher because the student hears it from one source and then it is reinforced by the teacher, giving the teacher a second hand because it’s now coming from two sources not just one.


After the video, the students can now split up into groups of at least 3 and create their own “Fire and Ice” roller coaster from scratch. They will have the information from the video to help them know how to create the function and may also ask questions. The student may create their hyperbola roller coaster anyway they would like, using any directrix as well. But keep in mind that you would probably want to tell them it needs to be somewhat realistic or else you could get some crazy ideas. Once all the groups are finished, they will present their roller coaster to the class and be graded by their peers for one grade and then graded by the teacher for participation and correctness.


green lineFrom previous math courses, the student should already know the terms slope and vertex. The student should’ve already learned how to graph a parabola. Everything that a student uses to graph a parabola is used to graph a hyperbola but yet with more information. Starting from the bottom, a parabola is used because all a hyperbola technically is, is the graph show a parabola and its mirrored image at the same time. From here the student learns about the directrix, which is the axis of symmetry that the parabola follows. The student will now be able to learn about asymptotes which are basically what a directrix is in a hyperbola function. This opens the door to several graphs of limits that the student will learn throughout calculus and higher math classes.


Writing in a History of Mathematics Capstone Course

Every so often, I’ll publicize through this blog an interesting article that I’ve found in the mathematics or mathematics education literature that can be freely distributed to the general public. Today, I’d like to highlight “Writing in a History of Mathematics Capstone Course,” by John Carter. Here’s the abstract:

This article presents two approaches to using original sources in a capstone writing project for a History of Mathematics course. One approach involves searching local libraries and is best suited to schools in metropolitan areas. A second approach involves online resources available anywhere. Both projects were used in a course intended for mathematics majors with an education concentration. The specific details of both projects will be discussed, including the motivation and setting, grading scheme, and revision process.

The full article can be found here: http://dx.doi.org/10.1080/10511970.2014.905809

Full reference:John Carter (2014) Writing in a History of Mathematics Capstone Course, PRIMUS: Problems, Resources, and Issues in Mathematics Undergraduate Studies, 24:6, 544-556, DOI:10.1080/10511970.2014.905809

Engaging students: Using right-triangle trigonometry

In my capstone class for future secondary math teachers, I ask my students to come up with ideas for engaging their students with different topics in the secondary mathematics curriculum. In other words, the point of the assignment was not to devise a full-blown lesson plan on this topic. Instead, I asked my students to think about three different ways of getting their students interested in the topic in the first place.

I plan to share some of the best of these ideas on this blog (after asking my students’ permission, of course).

This student submission comes from my former student Shama Surani. Her topic, from Precalculus: using right-triangle trigonometry.

green line

How could you as a teacher create an activity or project that involves your topic?

bridge

A project that Dorathy Scrudder, Sam Smith, and I did that involves right-triangle trigonometry in our PBI class last week, was to have the students to build bridges. Our driving question was “How can we redesign the bridge connecting I-35 and 635?” The students knew that the hypotenuse would be 34 feet, because there were two lanes, twelve feet each, and a shoulder of ten feet that we provided on a worksheet. As a group, they needed to decide on three to four angles between 10-45 degrees, and calculate the sine and cosine of the angle they chose. One particular group used the angle measures of 10°, 20°, 30°, and 40°. They all calculated the sine of their angles to find the height of the triangle, and used cosine to find the width of their triangle by using 34 as their hypotenuse. The picture above is by Sam Smith, and it illustrates the triangles that we wanted the students to calculate.


The students were instructed to make a scale model of a bridge so they were told that 1 feet = 0.5 centimeters. Hence, the students had to divide all their calculations by two. Then, the students had to check their measurements of their group members, and were provided materials such as cardstock, scissors, pipe cleaners, tape, rulers, and protractors in order to construct their bridges.  They had to use a ruler to measure out what they found for sine and cosine on the cardstock, and make sure when they connected the line to make the hypotenuse that the hypotenuse had a length of 17 centimeters. After they drew their triangles, they had to use a protractor to verify that the angle they chose is what one of the angles were in the triangle. When our students presented, they were able to communicate what sine and cosine represented, and grasped the concepts.

Below are pictures of the triangles and bridges that one of our groups of students constructed. Overall, the students enjoyed this project, and with some tweaks, I believe this will be an engaging project for right triangle trigonometry.

studentbridge3 studentbridge2 studentbridge1

green line

How does this topic extend what your students should have learned in previous courses?


In previous classes, such in geometry, students should have learned about similar and congruent triangles in addition to triangle congruence such as side-side-side and side-angle-side. They should also have learned if they have a right angle triangle, and they are given two sides, they can find the other side by using the Pythagorean Theorem. The students should also have been exposed to special right triangles such as the 45°-45°-90° triangles and 30°-60°-90° triangles and the relationships to the sides. Right triangle trigonometry extends the ideas of these previous classes. Students know that there must be a 45°-45°-90° triangle has side lengths of 1, 1, and \sqrt{2} which the lengths of 1 subtending the 45° angles. They also are aware that a 30°-60°-90° produces side lengths of 1, \sqrt{3} , and 2, with the side length of 1 subtending the 30°, the length of \sqrt{3} subtending the angle of 60°, and the length of 2 subtending the right angle. So, what happens when there is a right angle triangle, but the other two angles are not 45 degrees or 30 and 60 degrees? This is where right triangle trigonometry comes into play. Students will now be able to calculate the sine, cosine, and tangent and its reciprocal functions for those triangles that are right. Later, this topic will be extended to the unit circle and graphing the trigonometric functions as well as their reciprocal functions and inverse functions.


green line

What are the contributions of various cultures to this topic?


Below are brief descriptions of various cultures that personally interested me.


Early Trigonometry


The Babylonians and Egyptians studied the sides of triangles other than angle measure since the concept of angle measure was not yet discovered. The Babylonian astronomers had detailed records on the rising and setting of stars, the motion of planets, and the solar and lunar eclipses.   On the other hand, Egyptians used a primitive form of trigonometry in order to build the pyramids.


Greek Mathematics


Hipparchus of Nicaea, now known as the father of Trigonometry, compiled the first trigonometric table. He was the first one to formulate the corresponding values of arc and chord for a series of angles. Claudius Ptolemy wrote Almagest, which expanded on the ideas of Hipparchus’ ideas of chords in a circle. The Almagest is about astronomy, and astronomy relies heavily on trigonometry.


Indian Mathematics


Influential works called Siddhantas from the 4th-5th centry, first defined sine as the modern relationship between half an angle and half a chord. It also defined cosine, versine (which is 1 – cosine), and inverse sine. Aryabhata, an Indian astronomer and mathematician, expanded on the ideas of Siddhantas in another important work known as Aryabhatiya. Both of these works contain the earliest surviving tables of sine and versine values from 0 to 90 degrees, accurate to 4 decimal places. Interestingly enough, the words jya was for sine and kojya for cosine. It is now known as sine and cosine due to a mistranslation.


Islamic Mathematics


Muhammad ibn Mūsā al-Khwārizmī had produced accurate sine and cosine tables in the 9th century AD. Habash al-Hasib al-Marwazi was the first to produce the table of cotangents in 830 AD. Similarly, Muhammad ibn Jābir al-Harrānī al-Battānī had discovered the reciprocal functions of secant and cosecant. He also produced the first table of cosecants.


Muslim mathematicians were using all six trigonometric functions by the 10th century.  In fact, they developed the method of triangulation which helped out with geography and surveying.


Chinese Mathematics


In China, early forms of trigonometry were not as widely appreciated as it was with the Greeks, Indians, and Muslims. However, Chinese mathematicians needed spherical geometry for calendrical science and astronomical calculations. Guo Shoujing improved the calendar system and Chinese astronomy by using spherical trigonometry in his calculations.


European Mathematics


Regiomontanus treated trigonometry as a distinct mathematical discipline. A student of Copernicus, Georg Joachim Rheticus, was the first one to define all six trigonometric functions in terms of right triangles other than circles in Opus palatinum de triangulis. Valentin Otho finished his work in 1596.


http://en.wikipedia.org/wiki/History_of_trigonometry


Engaging students: Finding domain and range

In my capstone class for future secondary math teachers, I ask my students to come up with ideas for engaging their students with different topics in the secondary mathematics curriculum. In other words, the point of the assignment was not to devise a full-blown lesson plan on this topic. Instead, I asked my students to think about three different ways of getting their students interested in the topic in the first place.

I plan to share some of the best of these ideas on this blog (after asking my students’ permission, of course).

This student submission comes from my former student Michelle Nguyen. Her topic, from Precalculus: finding domain and range.

green line

What interesting word problems using this topic can your students do now?

Problem: Joe has an afterschool job at the local sporting goods store. He makes $6.50 an hour. He never works more than 20 hours in a week. The equation s(h)=6.5h can be used to model this situation, where h represents the number of hours Joe works in a week . What is the appropritate domain and range for this problem?

Students will be able to state the domain has to be from 0 to 20 because Joe never works over 20 hours and he can not work negative hours. With the range, the students would have to plug in 20 into the equation and get 130. The range will not exceed 130 because the maximum hours Joe will work is 20 hours. The students will know that Joe cannot be able to earn negative money either. Because of this, students will be able to identify that the range of this problem is from 0 to 130.

https://secure.lcisd.org/schools/HighSchools/FosterHighSchool/Faculty/Math/KarenKlobedans/Algebra2/images/Notes%209-2%20Domains%20and%20Ranges%20from%20Word%20Problems.pdf


green line

How could you as a teacher create an activity or project that involves your topic?

After learning about the definition of domain and range, I would use a matching activity to assess the students’ knowledge about the topic. For example, I would have different graphs on different cards and their domain and range on another card. The students would shuffle the cards and then find their matching pairs. By doing this, the students would have to discuss with their group or partner about why their domain and range card matches with their graph card. Students will be able to identify the range and domain that would make sense to them and be able to back up their conclusion with what they know about domain and range.


green line

How does this topic extend what your students should have learned in previous courses?

Finding the domain and range can be an extension of learning functions. Students have been exposed to functions and their graphs already before this topic is introduced. With the knowledge of functions, students are able to find the domain and range with a graph given. Since they are able to do that, students have prior knowledge to the meaning of x-axis and y-axis. Domain and range is just another word for x and y axis. The students have already been exposed to graphs of different functions and the students have learned how to make their own graph if only an equation is given. Students will most likely make a table with coordinates to graph their graph. With this knowledge, they are able to use it to find the domain and range of a function.

Issues when conducting political polls

The classic application of confidence intervals is political polling: the science of sampling relatively few people to predict the opinions of a large population. However, in the 2010s, the art of political polling — constructing representative samples from a large population — has become more and more difficult.

FiveThirtyEight.com wrote a recent article, Is The Polling Industry in Statis or in Crisis?, about the nuts and bolts of conducting a survey that should provide valuable background information for anyone teaching a course in statistics. From the opening paragraphs:

There is no shortage of reasons to worry about the state of the polling industry. Response rates to political polls are dismal. Even polls that make every effort to contact a representative sample of voters now get no more than 10 percent to complete their surveys — down from about 35 percent in the 1990s.

And there are fewer high-quality polls than there used to be. The cost to commission one can run well into five figures, and it has increased as response rates have declined.1 Under budgetary pressure, many news organizations have understandably preferred to trim their polling budgets rather than lay off newsroom staff.

Cheaper polling alternatives exist, but they come with plenty of problems. “Robopolls,” which use automated scripts rather than live interviewers, often get response rates in the low to mid-single digits. Most are also prohibited by law from calling cell phones, which means huge numbers of people are excluded from their surveys.

How can a poll come close to the outcome when so few people respond to it?

Is The Polling Industry In Stasis Or In Crisis?

Engaging students: Mathematical induction

In my capstone class for future secondary math teachers, I ask my students to come up with ideas for engaging their students with different topics in the secondary mathematics curriculum. In other words, the point of the assignment was not to devise a full-blown lesson plan on this topic. Instead, I asked my students to think about three different ways of getting their students interested in the topic in the first place.

I plan to share some of the best of these ideas on this blog (after asking my students’ permission, of course).

This student submission comes from my former student Michael Dixon. His topic, from Precalculus: mathematical induction.

green line

How can this topic be used in your studentsfuture courses in mathematics or science?


The first time student are introduced to mathematical proofs is probably in high school geometry class, proving theorems using the axiomatic method. They work to prove things about Euclidean geometry with step by step deductive reasoning, as did Euclid himself in the Elements. They prove things about concrete objects that they can see and draw on paper, such as circles, angles, lines, and triangles. But then they move on to Algebra II where they are taught more abstract ways of dealing with numbers and expressions. Is there any way to prove things about numbers themselves? It’s not as easy to visualize, that’s for sure. What is a number? Is it something I can see and feel; is it the shape we write on the page? Or is it something beyond that? This aspect is one of the challenges that algebra students face as they are exposed to more and more mathematics. Mathematical Induction is one way to prove things about numbers using solid deductive reasoning that cannot be refuted. And not just about a few numbers; high school students would be more accepting of that. Mathematical induction is usually used to prove something about ALL of the natural numbers, starting from one and going on out past infinity. Induction can be used to prove what students might intuitively think about the natural numbers, such as that there are an infinite number of primes, or it can be used to prove less obvious things about numbers, such as 1 + 3 + 5 + 7 + …+ n = n2. We can prove these and more without having to compute billions and billions of cases. In just a few lines of mathematical logic, we can prove that something is true for every natural integer. This is more than just telling the students something and them accepting it, this technique PROVES that some statements are always true for any number we want to choose, no matter how large it is. That’s some powerful stuff.


green line

How was this topic adopted by the mathematical community.


Mathematical induction has been around for thousands of years. While not in the same form as we see it today, induction can be seen all the way back to Euclid’s proof that there are an infinite number of primes, or in the writings of Aristotle. They used this logic to prove a lot of things, but it was not in the formal way of proving something about n and n + 1. This formal notation did not show up until around 1575, when Maurolycus that 1 + 3 + 5 + 7 + …+ n = n2, though he did not prove using n and n + 1, yet. Several mathematicians began using this formal method soon after, such as Pascal and , though no one had a name for it. Bernoulli then was one of the first to begin using the method of arguing from n to n + 1. Since then, mathematicians have been heavily using this method to prove countless things about the natural numbers. And eventually, around the 20th century the name itself, mathematical induction, finally became the standard term for the method starting over two thousand years ago.


green lineHow can technology be used to effectively engage students with this topic?


These videos cover mathematical induction in a way I hadn’t seen before, and cleared up a misconception that I had. I had always thought (because of the name) that mathematical induction was not the same kind of reasoning that is used in other axiomatic proofs. However, mathematical induction happens to actually be deductive reasoning, rather than inductive reasoning. The only similarity is that both mathematical induction and inductive reasoning deal with occurring patterns. The first video is more the engage part, while the second one goes a lithe further into the content. For the engage, showing the video at the beginning of the class is probably better, while the second might be given to the students as homework to watch on their own.


Resources

http://www.onlinemathlearning.com/mathematical-induction.html

http://pballew.blogspot.com/2009/09/mathematical-induction-brief-history-of.html

http://youtu.be/R6U-HXV-17Q

http://youtu.be/JRRMjaarOx4


25,000 page views

I’m taking a one-day break from my usual posts on mathematics and mathematics education to note a symbolic milestone: meangreenmath.com has had more than 25,000 total page views since its inception in June 2013. Many thanks to the followers of this blog, and I hope that you’ll continue to find this blog to be a useful resource to you.

green line

Some other (probably useless) statistics: this blog has been viewed by readers from 145 different countries. Top viewership: the United States, India, the Philippines, Canada, the United Kingdom, Australia, Brazil, Pakistan, Singapore, and France.

Ten most viewed posts (written by me):

  1. All I want to be is a high school math teacher. Why do I have to take Real Analysis?
  2. An infinite number of mathematicians walk into a bar
  3. Formula for a finite geometric series (Part 8)
  4. Full lesson plan: Platonic solids
  5. Fun with Dimensional Analysis
  6. Geometric magic trick
  7. My “history” of solving cubic, quartic and quintic equations
  8. MyScript MathPad: Handwriting LaTeX generator
  9. Square roots and logarithms without a calculator: Part 2, Part 3, Part 4, Part 5, Part 6
  10. Student misconceptions about PEMDAS

Ten most viewed posts (guest presenters):

  1. Engaging students: Deriving the Pythagorean theorem
  2. Engaging students: Distinguishing between axioms, postulates, theorems, and corollaries
  3. Engaging students: Distinguishing between inductive and deductive reasoning
  4. Engaging students: Factoring quadratic polynomials
  5. Engaging students: Laws of Exponents
  6. Engaging students: right-triangle trigonometry
  7. Engaging students: Solving linear systems of equations by either substitution or graphing
  8. Engaging students: Solving linear systems of equations with matrices
  9. Engaging students: Solving one-step and two-step inequalities
  10. Engaging students: Solving quadratic equations

Top five referrals not written by me (thank you!):

  1. http://ispeakmath.org/2012/05/03/square-roots-with-cheez-its-and-a-graphic-organizer/
  2. http://www.reddit.com/r/learnmath/comments/2alfmp/algebra_square_roots_how_do_you_find_a_square/
  3. http://www.reddit.com/r/mentalmath/comments/22mogi/square_roots_and_logarithms_without_a_calculator/
  4. http://hogamy.wordpress.com/2014/04/12/common-core-subtraction-and-the-open-number-line-part-4/
  5. http://mathwithbaddrawings.com/2014/01/22/39-ways-to-love-math/

Top ten search engine terms that landed people on my blog:

  1. systems of equations project / system of equations project / system of linear equations project / system of equations project ideas
  2. geometry tricks
  3. law of exponents foldable / exponent rules foldable
  4. tables
  5. cavalieri’s principle
  6. mean green math (hey, it works!)
  7. how to find square root using log book
  8. green math
  9. mathematical table
  10. student art work with circles and parabolas

Ten other search engine terms that caught my attention:

  1. deercrossing sign phone call
  2. engaging students in reading lesson
  3. examples of inductive and deductive reasoning in the declaration of independence
  4. grape and triangle pun
  5. great clean jokes 2013
  6. math rap on solving systems of equations with substitution
  7. meetkunde trucjes
  8. slide rule advertisement
  9. the stereotypes about math that hold americans back
  10. youtube/danceofchanceprobabilityfromanormalcurve