I used these shirts as props when teaching Precalculus this week, and they worked like a charm.
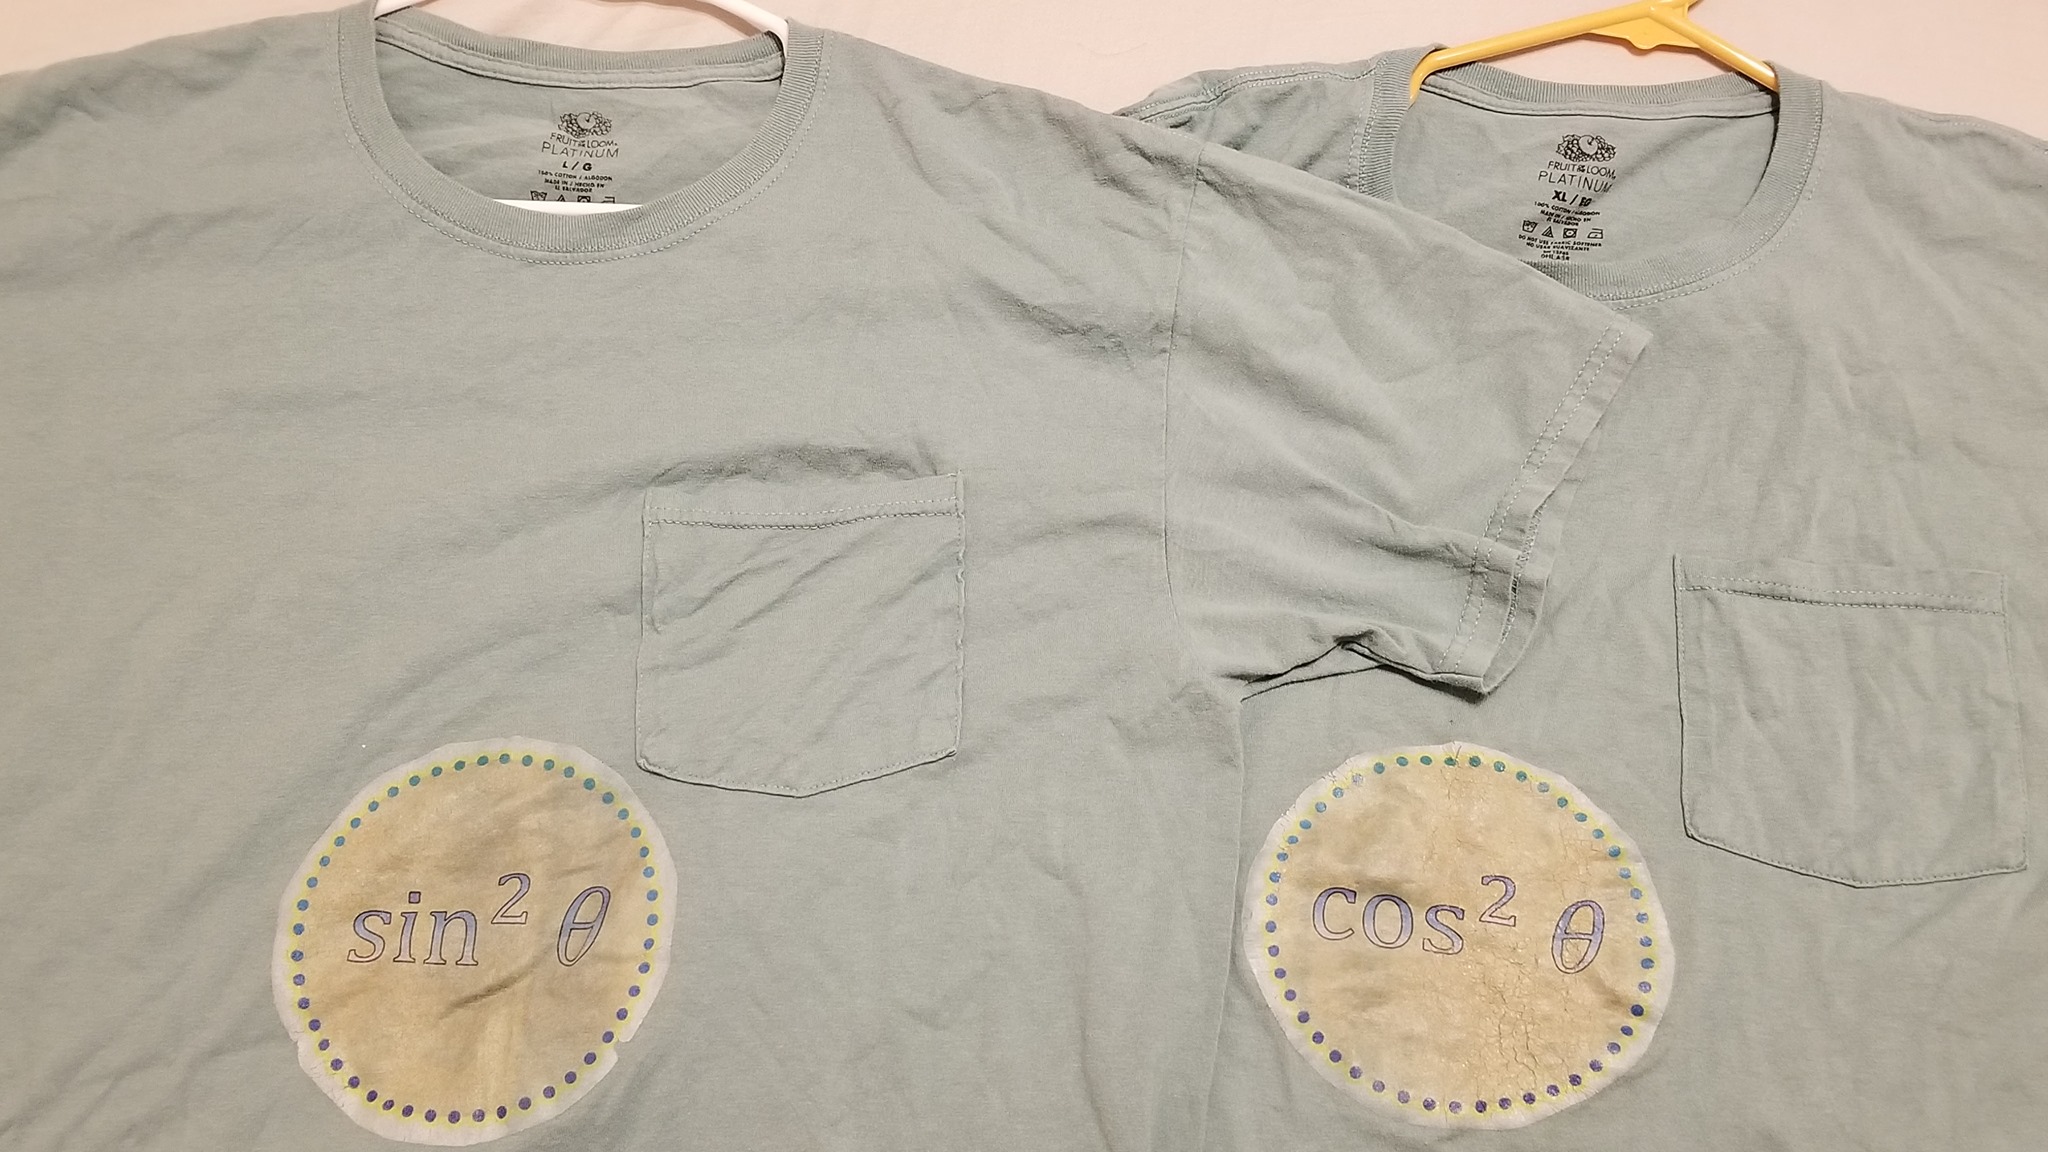
After deriving the three Pythagorean identities from trigonometry, I told my class that I got these hand-made his-and-hers T-shirts for my wife’s birthday a couple of years ago. If you can’t see from the picture, one says and the other .
After holding up the shirts, I then asked the class what mathematical message was being communicated.
After a few seconds, someone ventured a guess: “We add up to 1?”
I answered, “That’s right. Together, we’re one.”
Whereupon the class spontaneously reacted with a loud “Awwwwwwwwww.”
In my capstone class for future secondary math teachers, I ask my students to come up with ideas for engaging their students with different topics in the secondary mathematics curriculum. In other words, the point of the assignment was not to devise a full-blown lesson plan on this topic. Instead, I asked my students to think about three different ways of getting their students interested in the topic in the first place.
I plan to share some of the best of these ideas on this blog (after asking my students’ permission, of course).
This student submission comes from my former student Biviana Esparza. Her topic, from Precalculus: graphing a hyperbola.
B2. How does this topic extend what your students should have learned in previous courses?
Prior to learning about conics and hyperbolas in precalculus, students should be able to identify different shapes and figures and learn to identify cross sections of prisms, pyramids, cylinders, cones, and spheres, from geometry class. In algebra 2, students learn to write quadratic equations and learn vocabulary such as vertex, foci, directrix, axis of symmetry, and direction of opening, all which are used when dealing with hyperbolas as well.
How has this topic appeared in pop culture?
The sport of baseball originates back before the Civil War and has come to be known as America’s pastime. On average, 110 balls are used in a major league baseball game, because the balls are usually tossed out if they’ve touched the dirt. Baseballs have a rubber or cork center, wrapped in yearn, and covered with leather sown together tightly by 108 stitches of red string. The stitches are in a hyperbola shape if looked at from a certain angle and depending on how the pitcher has held the stitches, different pitches are thrown.
E1. How can technology be used to effectively engage students with this topic?
Desmos is a great, interactive website that has many activities that can be used in the classroom. One of the activities it has is called Polygraph: Conics. The Desmos activity is similar to the board game Guess Who? in which students are in pairs and will ask yes or no questions to guess the graph of a hyperbola or ellipse of their choosing. This activity encourages students to make good questions and use precise vocabulary and academic language when describing conics, specifically over ellipses and hyperbolas, so that they can win the game. https://teacher.desmos.com/polygraph/custom/560ad28c9e65da5615091ec7
In my capstone class for future secondary math teachers, I ask my students to come up with ideas for engaging their students with different topics in the secondary mathematics curriculum. In other words, the point of the assignment was not to devise a full-blown lesson plan on this topic. Instead, I asked my students to think about three different ways of getting their students interested in the topic in the first place.
I plan to share some of the best of these ideas on this blog (after asking my students’ permission, of course).
This student submission comes from my former student Tiger Hersh. His topic, from Precalculus: the Law of Sines.
How does this topic extend what your students should have learned in previous courses?
This topic can be extended to geometry where students must be able to use trigonometric identities (1) to identify the degree or length in order to use the Law of Sines. The issue about trigonometric identities is that you can only use them on right triangles (2). However, with the Law of Sines, students are able to use the trigonometric identities they have learned in Geometry and are able to draw a perpendicular line across a non-right triangle (3) and then apply the Law of Sines to solve either the height of the triangle, the length of the side of the triangle, or the degree of an angle of the triangle. So, the Law of Sines use the idea of trigonometric identities from Geometry in order to be applicable.
How can this topic be used in your students’ future courses in mathematics or science? Unit circle calculus / solving for height of triangles
Students are able to the Law of Sines in order to find the height or degree of a triangle on the unit circle in precalculus or to calculator vector quantities in physics. The Law of Sines is prominent in the unit circle which is noticeable in the linked website which will provide students a connection from the Law of Sines to the unit circle. The Law of Sines also connects to physics where vectors used to show motion and direction in two dimensional space. The Law of sines may also be applied in physics where in (2); The vectors form a non-right triangle. The vectors ‘length’ can be determined by identifying the magnitude of each vector and then using the method as described before to use the Law of Sines in-order to find vector r.
How has this topic appeared in pop culture (movies, TV, current music, video games, etc.)?
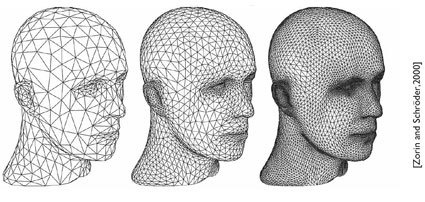
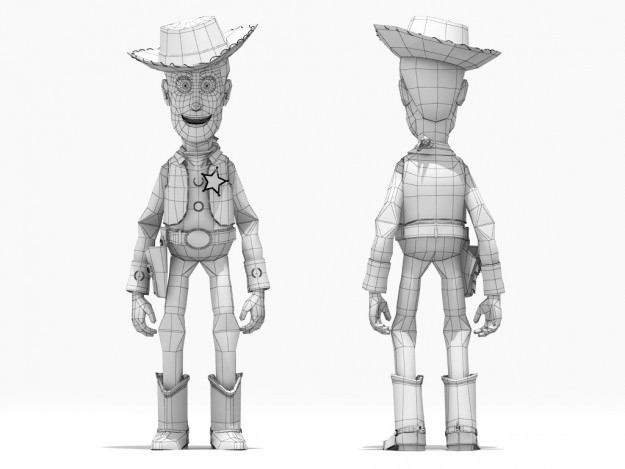
The law of sines has appeared in almost every 3 dimensional video games known to exist that has characters that are rendered with polygons. To note: it’s not just any polygon that can be used to create the characters you see in video games but specifically, they usually use triangles to render the characters. Even some movies that use animation software use these triangular polygons to render the figures in the movie; like for example Woody from the movie Toy Story (as seen below with polygons). We can use the Law of Sines in order to find the length or degree of each triangle on the figure if we were willing so.
In my capstone class for future secondary math teachers, I ask my students to come up with ideas for engaging their students with different topics in the secondary mathematics curriculum. In other words, the point of the assignment was not to devise a full-blown lesson plan on this topic. Instead, I asked my students to think about three different ways of getting their students interested in the topic in the first place.
I plan to share some of the best of these ideas on this blog (after asking my students’ permission, of course).
This student submission comes from my former student Marlene Diaz. Her topic, from Precalculus: graphing rational functions.
How can this topic be used in your students’ future courses in mathematics or science?
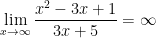
When graphing rational functions, we are able to see the different asymptotes a function has. A rational function has horizontal, vertical and sometimes slant asymptotes. Knowing how to find the asymptotes and knowing how to graph them can help in future classes like Calculus and calculus 2. In those classes you will learn about limits. When finding the limit of a rational function the horizontal asymptote is checked and that’s what the limit is approaching. For example, we have BOTU, which is big on top is undefined, when undefined it can either be to negative or positive infinity and depending on what x is approaching. For example,
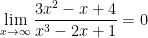
in this case we see that x has a higher degree on top therefore the limit is infinity. Another example would be
in this example we have that the degree is higher at the denominator therefore the limit is zero. In both cases we are able to evaluate both the limit and the horizontal asymptote and how they work with each other.
How could you as a teacher create an activity or project that involves your topic?
A fun activity that can be created to enforce the learning of graphing rational functions is a scavenger hunt. A student can be given a rational function to start the game, they have to find all the pieces that would help them find the graph of the function. The pieces they would have to have include the horizontal and vertical asymptotes. Once they find one piece at the back of the notecard there would be a hint of where the other piece can be. There would be other pieces mixed in with the correct one and the students would have to figure out which one they need. After they are done collecting all their cards, they would show them to the teacher and if it’s correct they get a second equation and if its incorrect they have to try again. This would most likely be played in groups of two and which ever team get the most correct will win a prize.
How can technology (YouTube, Khan Academy [khanacademy.org], Vi Hart, Geometers Sketchpad, graphing calculators, etc.) be used to effectively engage students with this topic? Note: It’s not enough to say “such-and-such is a great website”; you need to explain in some detail why it’s a great website.
Something I have always used as a review or to better understand a topic is Khan Academy. The reason I think this website helps me is because you are able to watch a video on how to graph a rational function, there are notes based on the video and there are different examples that can be attempted by the student. Furthermore, the link I found to help learn the graphing of rational functions breaks every step down with different videos. The first video is called graphing rational functions according to asymptotes, the next one is with y-intercepts and the last one is with zeros. After seeing all the videos there are practice problems that the students can do. At the end of the link there are more videos but, in these videos, you can ask any questions that the you might still have, and you can also see previous questions asked. The way the website is organized and detailed can be very beneficial for a student to use and it is always good to give students different explanations of the topic. The link to Khan Academy is: https://www.khanacademy.org/math/algebra2/x2ec2f6f830c9fb89:rational/x2ec2f6f830c9fb89:rational-graphs/v/horizontal-vertical-asymptotes
In my capstone class for future secondary math teachers, I ask my students to come up with ideas for engaging their students with different topics in the secondary mathematics curriculum. In other words, the point of the assignment was not to devise a full-blown lesson plan on this topic. Instead, I asked my students to think about three different ways of getting their students interested in the topic in the first place.
I plan to share some of the best of these ideas on this blog (after asking my students’ permission, of course).
This student submission comes from my former student Andrew Cory. His topic, from Precalculus: solving exponential equations.
B1. How can this topic be used in your students’ future courses in mathematics or science?
Solving exponential equations is important for students in their future courses. It can apply to mathematics courses in things like finances. Exponential growth is important for figuring out interest rates and how money will grow. It is also important for figuring out the growth rates of bacteria in science classes. This is the most common example used for solving exponential equations and it can help students with science classes they may take in the future.
A2. How could you as a teacher create an activity or project that involves your topic?
An activity that can be used to get students engaged in a lesson involving exponential equations and exponential growth, can be a quick example of a disease spreading. The teacher can select a student to start out “infected” and they stand up and walk around the classroom and tap a student on the shoulder. Now that student is also “infected.” Now the two students each tap a new person on the shoulder. Then those four people would go “infect” other students. Pretty quickly, the entire class will be standing up, “infected.” This is a good quick activity to get students to understand how the growth of exponential equations increases quickly. It also allows students to get up and move around, which is always good to do with how long students have to sit down during school.
C1. How has this topic appeared in pop culture (movies, TV, current music, video games, etc.)?
Exponential equations have to do with the growth of any populations. One that became very popular recently is the idea of zombies. The idea of exponential growth happens with how rapidly the disease outbreak happens and how quickly the zombie population overtakes the human population. This idea grew in popularity exponentially a few years ago, but has since died out a bit. The idea of how rapidly a disease could spread was intriguing to audiences, but little did they know, they were learning about exponential growth while watching popular TV shows.
In my capstone class for future secondary math teachers, I ask my students to come up with ideas for engaging their students with different topics in the secondary mathematics curriculum. In other words, the point of the assignment was not to devise a full-blown lesson plan on this topic. Instead, I asked my students to think about three different ways of getting their students interested in the topic in the first place.
I plan to share some of the best of these ideas on this blog (after asking my students’ permission, of course).
This student submission comes from my former student Diana Calderon. Her topic, from Precalculus: introducing the number .
How could you as a teacher create an activity or project that involves your topic?
– A project that I would want my students to work on that would introduce the number would be with having a weeklong project, assuming it is a block schedule, to allow the students to think about compound interest. the reason why we would use the compound interest formula to show is because, “It turns out that compounding weekly barely yields any more money than compounding monthly and at higher values of , it gets closer and closer to what we recognize as the number ” The project would be about buying a car, the students would get to choose the car that they want, research multiple car dealerships, and they must figure out the calculations for compound interest in 24 months, 36 months, 48 months, 60 months and 72 months. For their final product they must have a picture/drawing of the car they chose to purchase, as well as choose the number of months they would like to finance for and the dealership they will purchase form. Finally, they must turn in a separate sheet with the calculations for the other months of finance they did not choose and why they chose not to choose them.
What interesting things can you say about the people who contributed to the discovery and/or the development of this topic?
– The number or better known as Euler’s number is a very important number in mathematics. Leonhard Euler was one of the greatest Swiss mathematicians from the 18th century. Although Euler was born in Switzerland, he spent much of his time in Russia and in Berlin. Euler’s father was great friends with Johan Bernoulli, who then became one of the most influential people in Euler’s life. Euler was also one who contributed to “ the mathematical notation in use today, such as the notation to describe a function and the modern notation for the trigonometric functions”. Not only did Euler contribute to math, “He is also widely remembered for his contributions in mechanics, fluid dynamics, optics, astronomy, and music.” Euler was such an amazing mathematician that other mathematicians talked very highly of him such as Pierre-Simon Laplace who expressed how Euler is important in mathematics, “‘Read Euler, read Euler, he is master of us all’”
How can technology (YouTube, Khan Academy [khanacademy.org], Vi Hart, Geometers Sketchpad, graphing calculators, etc.) be used to effectively engage students with this topic?
– This video would be great to show to students to see how the number e is applied in different ways. The video starts off by talking about how we get , “mathematically it is just what you get when you calculate 1 + (1/1000000)^1000000= 2.718 ≈ e and as the number gets bigger, you get Euler’s number, e=lim n→∞ f(n) (1+1/n)^n.” This is a really good video to show because the YouTuber talks about how when he was learning about the number e, he thought that it would never show up and then later realized that the better question was, when doesn’t it show up? He then proceeds to talk about how if you’re in high school then you start talking about it when it comes to compound interest, he then proceeds to give an example, “imagine you put $1 in a bank that pays out 100% interest per year, that means after one year you’ll have two dollars but that’s only if th interest compounds once a year. If instead it compounds twice a year you get 50% after 6 months and another 50% after 6 more months.”, and so on, he explains up to daily and compounding every second, nanosecond and so on, the amount in that persons bank would become $e ($2.1718). He then gives a real-world examples of probability with the number e. I would stop this video at 3:09 because that would give enough insight to the students about other applications of the number e and why it useful for them to learn it and not just think about it as a button in their calculator.
In my capstone class for future secondary math teachers, I ask my students to come up with ideas for engaging their students with different topics in the secondary mathematics curriculum. In other words, the point of the assignment was not to devise a full-blown lesson plan on this topic. Instead, I asked my students to think about three different ways of getting their students interested in the topic in the first place.
I plan to share some of the best of these ideas on this blog (after asking my students’ permission, of course).
This student submission comes from my former student DeForest Mitchell. His topic, from Precalculus: graphing sine and cosine functions.
C2: How has this topic appeared in high culture (art, classical music, theatre, etc.)?
There are multiple forms of art and music and theater using sine and cosine. I am going to focus on music. Tone and sound in itself is a reverb of sine functions with different wavelengths and amplitude. This is such a great importance not only in knowing sine functions but also being able to create music. Knowing what a tone is and why the sound is becoming higher/lower or quieter/louder. If the amplitude is shorter then the sound itself will be quieter and vise versa with the amplitude growing so will the over all sound. If the period is increasing or becoming longer, the sound will be deeper, while shorter periods will create sharper and higher pitch sounds. Once you combine the amplitude and the period in specific ways that’s how specific notes and tones are made. As shown below, there is a combination of amplitudes and periods to create a sound wave using sine functions. With this in mind mathematically you can predict what a tone or song will sound like just depending on the inflection of amplitude and frequency of the function.
B1: How can this topic be used in your students’ future courses in mathematics or science?
One big component to my personal understanding of graphing sine and cosine is seeing a physical model of it. Such as a spring in physics, or the light spectrum. There are websites such as https://www.mathsisfun.com/algebra/trig-sin-cos-tan-graphs.html to be able to represent a sine function being sketched as a weighted spring bounces up and down. There are different slides to adjust the stiffness and dampening of the spring to show the alternate forms of the same graph. Since and cosine are used in many different forms of sciences, such as wavelengths (as shown in the picture below). This is a great way to show the students that there is a reason to learn the subject and that there are practical uses for it in life outside of school. For example, with the wavelength spectrum a teacher can make the correlation that a sine function with a longer period would be like soundwaves that have a longer wavelength, also to show that there are only certain wavelengths that we can see and there can be a correlation to graph the sine period and that if you were to make it into a function that there is only a certain few period lengths for a sine function for humans to be able to see colors.
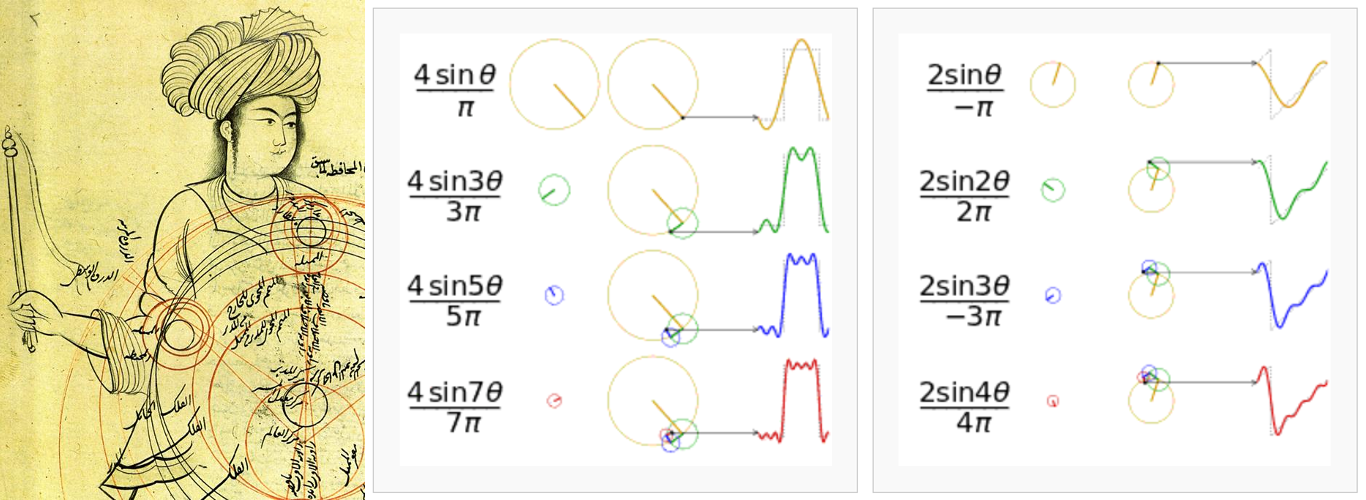
D1: What interesting things can you say about the people who contributed to the discovery and/or the development of this topic? (You might want to consult Math Through The Ages.)
Circles have been around for millions of years and are to this day one of the simplest shapes. With Circles and by tracking the circumference of the circle you can make sine and cosine graphs. Joseph Fourier (1768 – 1830 A.D.) was a very influential person with the devilment of graphing sine and cosine functions. He was so due to his the foundning of the Fourier series. “Fourier series (thus the Fourier transform and finally the Discrete Fourier Transform) is our ancient desire to express everything in terms of circles or the most exceptionally simple and elegant abstract human construct. Most people prefer to say the same thing in a more ahistorical manner: to break a function into sines and cosines.” The summative way to say saying that Fourier came up with an equation to take any repeating series and be able to turn it into forms of sine and cosine to be able to graph. Which in turn creates a circle to better understand the said repeating series. This was a great mathematical find to show the correlation between any repeating series and the more well-known sine and cosine terms today. As shown below, with the Fourier series they were able to take a repeating series to “convert” them into a circle and then be able to graph the functions in terms of sine and cosine.
In my capstone class for future secondary math teachers, I ask my students to come up with ideas for engaging their students with different topics in the secondary mathematics curriculum. In other words, the point of the assignment was not to devise a full-blown lesson plan on this topic. Instead, I asked my students to think about three different ways of getting their students interested in the topic in the first place.
I plan to share some of the best of these ideas on this blog (after asking my students’ permission, of course).
This student submission again comes from my former student Eduardo Torres Manzanarez. His topic, from Algebra: fitting data to a quadratic function.
How could you as a teacher create an activity or project that involves your topic?
One interesting project that could be done to invoke quadratic modeling is for students to develop a model that fits a business’ data of labor and output. The basic model of labor and output for a given company can be modeled by a quadratic function and it can be used to determine important figures such as the maximum output, minimum output, maximum labor, and minimum labor. The following image is an example of such a relationship.
In general, people would think that the more labor and resources used at the exact same time results in more product. If you have more product produced, then you accumulate more profit. These ideas are not wrong to be thought of but a key aspect that is missed in the thought process is that of land or otherwise known as workspace. The more employees you hire, the more space required so that these individuals can produce but space is limited just like any other resource. Lack of space inhibits production flow and therefore decreases product, decreases profits, and increases cost through increased wages. All of this does not occur until you pass the maximum of the model. So, both of these behaviors are shown and exhibited by a quadratic function. Students can realize these notions of labor and production by analyzing data of various companies. An activity that could show such a relationship in action is having one student create a small particular product such as a card with a particular design and produce as many as they can in a certain amount of time, with certain resources, and a workspace. Record the number of cards produced. Next, have two students create cards with the exact same time, resources, and workspace and record the amount produced. As more students are involved, the behavior of labor and production will be shown to be direct and then inverse to each other. The final piece for this activity would be for students to find realize what function seems to have the same shape as the data on a graph and for them to manipulate the function so that it fits on the data. Turns out the function will have to be a quadratic function.
B1) How can this topic be used in your students’ future courses in mathematics or science?
Fitting data onto a quadratic function is useful in analyzing behavior between variables. In various mathematical courses, data is provided but in science usually one must come up with data through an experiment. Particularly there are many situations in physics where this is the case and relationships have to be modeled by fitting data onto various functions. Doing quadratic modeling and even linear modeling early on is a good introduction into other models that are used in the many fields of science. Not every experiment is recorded perfectly and hence there can never be a perfect model. Through analytical skills presented in this topic, it scaffolds students to find a model for bacteria growth, a model for velocity, a model for the position of an object, and a model for nuclear decay in the future and what to expect the behavior of these models to be. This topic in combination with limits from calculus builds onto piece-wise models for probability and statistics.
E1) How can technology be used to effectively engage students with this topic?
Technology such as graphing calculators, Excel, Desmos, and TI-Nspires can be used to create the best model possible based on least-squares regression. This technology is engaging in developing models, not because of the lack of convoluted math that deals with squaring differences but rather the focus on analyzing particular models such as a quadratic model. They could be engaging for students when students can input particular sets of data they find interesting and need a way to model it. Furthermore, students can use technology to develop beautiful graphs that can be easily interpreted than rough sketches of these models. TI-Nspire software can be used by a teacher to send a particular data set to students and their own TI-Nspires. Students can then insert a quadratic function on the graphing application and manipulate the function by changing its overall shape by the mouse cursor. This allows students to dictate their own particular models and allows for comparison between models as to which is more accurate for particular data.
In my capstone class for future secondary math teachers, I ask my students to come up with ideas for engaging their students with different topics in the secondary mathematics curriculum. In other words, the point of the assignment was not to devise a full-blown lesson plan on this topic. Instead, I asked my students to think about three different ways of getting their students interested in the topic in the first place.
I plan to share some of the best of these ideas on this blog (after asking my students’ permission, of course).
This student submission again comes from my former student Diana Calderon. Her topic, from Algebra: adding, subtracting, and multiplying matrices.
How could you as a teacher creates an activity or project that involves your topic?
As a teacher I would do a foldable activity in which the students will have to fill in the blank in the front of the foldable that would allow them to discover how addition, multiplication and subtraction work for matrices. Once they open the foldable, they would have to do different examples and get to also create one. Out of the problems that the students create, as a teacher, I would choose one of each and allow them to go up to the board and explain how they did it and address any misconceptions that may have happened when they were discovering how the concepts work. I plan on doing my foldable with color coding so that the students can see where the numbers in the columns and rows changed when the matrices were added, multiplied, or subtracted, I will most likely limit the matrices to vary from 2×1,2×2,2×3,3×2,and 3×3.
How does this topic extend what your students should have learned in previous courses?
– The topic of adding, subtracting and multiplying matrices allows students to extend their knowledge when it comes to adding, multiplying or subtracting polynomials. I can show the students how a polynomial is similar to a 1×1 matrix. Another subject that they may see something similar to matrices would be in Biology with the punnett squares, it can be as basic as doing it for one generation or two and then go from there on. As said in the article “Use of Matrices to Determine Genetic Probability” by Andrew Almendarez, “Through prescribed manipulations and interpretations matrices can be used to represent and solve physical problems. One such problem is finding the probability of a certain genotype within a population over multiple generations.”, this also ties into probability which they most likely learned the previous year. It would be good to tell them that if they are interested in the medical lab field for example, “trying to breed cows that produce the most milk. If cows of a certain genotype were known to produce more milk than others it is useful to know how many cows of that genotype there will be after a number of generations, and what will maximize the proportion of that genotype in the future. This is where the Punnett is used in conjunction with matrices”.
How has this topic appeared in pop culture (movies, TV, music, video games, etc.)?
The topic of matrix multiplication came up when I looked in the news. Recently, apple has been one of the most popular brands when it comes to computers, cellular devices, TV, ear phones, etc. With that being said, every year or so they release a new “it” item. This month they are releasing the new iPhone 11, which overall in my opinion is the best cellular device one can get, it has a sleek professional design, great camera, a huge amount of storage embedded within itself and many other useful resources that one utilizes in their everyday life. In the article “iPhone 11: Apple’s A13 Bionic Chip Enables More Than Just Faster Speed” it mentions matrices and how “The A13 Bionic has a whopping 8.5 billion second-generation seven-nanometer transistors, up from 6.9 billion in the previous generation. It can perform one trillion operations per second, thanks in part to new machine learning accelerators that can run matrix multiplication six times faster.”. For me it is amazing to know just how fast these devices can calculate anything and everything one wants to find out instead of doing it by hand.


 .
. , it gets closer and closer to what we recognize as the number
  to describe a function and the modern notation for the trigonometric functions”. Not only did Euler contribute to math, “He is also widely remembered for his contributions in mechanics, fluid dynamics, optics, astronomy, and music.” Euler was such an amazing mathematician that other mathematicians talked very highly of him such as Pierre-Simon Laplace who expressed how Euler is important in mathematics, “‘Read Euler, read Euler, he is master of us all’”