Engaging students: Equation of a circle

In my capstone class for future secondary math teachers, I ask my students to come up with ideas for engaging their students with different topics in the secondary mathematics curriculum. In other words, the point of the assignment was not to devise a full-blown lesson plan on this topic. Instead, I asked my students to think about three different ways of getting their students interested in the topic in the first place.

I plan to share some of the best of these ideas on this blog (after asking my students’ permission, of course).

This student submission comes from my former student Alyssa Dalling. Her topic, from Precalculus: the equation of a circle.

green line

A. How could you as a teacher create an activity or project that involves your topic?

A fun way to engage students and also introduce the standard form of an equation of a circle is the following:

  • Start by separating the class into groups of 2 or 3
  • Pass each group a specific amount of flashcards. (Each group will have the same flashcards)
  • Each flashcard has a picture of a graphed circle and the equation of that circle in standard form
  • The students will work together to figure out how the pictures of the circle relate to the equation

This will help students understand how different aspects of a circle relate to its standard form equation. The following is an example of a flashcard that could be passed out.

equationofcircle

Source: http://www.mathwarehouse.com/geometry/circle/equation-of-a-circle.php

green line

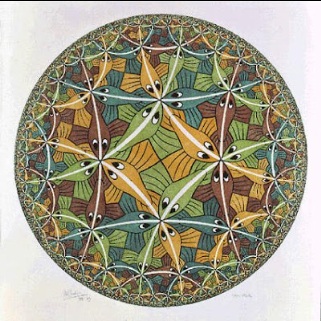
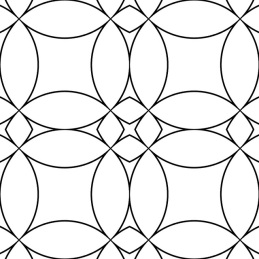
C. How has this topic appeared in high culture (art, classical music, theatre, etc.)?

Circles have been used through history in many different works of art. One such type is called a tessellation. The word Tessellate means to cover a plane with a pattern in such a way as to leave no region uncovered. So, a tessellation is created when a shape or shapes are repeated over and over again. The pictures above show just a few examples of how circles are used in different types of art. A good way to engage students would be to show them a few examples of tessellations using circles.

Source: http://mathforum.org/sum95/suzanne/whattess.html

equationofcircle4equationofcircle2equationofcircle3

green line

E. How can technology be used to effectively engage students with this topic?

Khan Academy has a really fun resource for using equations to graph circles. At the beginning of class, the teacher could allow students to play around with this program. It allows students to see an equation of a circle in standard form then they would graph the circle. It gives hints as well as the answer when students are ready. The good thing about this is that even if a student goes straight to the answer, they are still trying to identify the connection between the equation of the circle and the answer Khan Academy shows.

http://www.khanacademy.org/math/trigonometry/conics_precalc/circles-tutorial-precalc/e/graphing_circles

Engaging students: Solving logarithmic equations

In my capstone class for future secondary math teachers, I ask my students to come up with ideas for engaging their students with different topics in the secondary mathematics curriculum. In other words, the point of the assignment was not to devise a full-blown lesson plan on this topic. Instead, I asked my students to think about three different ways of getting their students interested in the topic in the first place.

I plan to share some of the best of these ideas on this blog (after asking my students’ permission, of course).

This student submission again comes from my former student Caitlin Kirk. Her topic: how to engage Algebra II or Precalculus students when solving logarithmic equations.

green line

B. Curriculum: How does this topic extend what your students should have learned in previous courses?

Logarithms are a topic that appears at multiple levels of high school math. In Algebra II, students are first introduced to logarithms when they are asked to identify graphs of parent functions including f (x) = logax. Later in the same class, they learn to formulate equations and inequalities based on logarithmic functions by exploring the relationship between logarithms and their inverses. From there, they can develop a definition of a logarithm.

Solving logarithmic equations extends what students learned about logarithms in Algebra II. Once a proper definition of logarithms has been established, along with a graphical foundation of logs, students learn to solve logarithmic equations.  Properties of logarithms are used to expand, condense, and solve logarithms without a calculator in Pre Calculus. Practical applications of the logarithmic equation also follow from previous skills. Students learn to calculate the pH of a solution, decibel voltage gain, intensity of earthquakes measure on the Richter scale, depreciation, and the apparent loudness of sound using logarithms.

green line

C. Culture: How has this topic appeared in the news?

One application of logarithmic equations is calculating the intensity of earthquakes measured on the Richter scale using the following equation:

R = \log(A/P)

where A is the amplitude of the tremor measured in micrometers and P is the period of the tremor (time of one oscillation of the earth’s surface) measured in seconds.

Reports of earthquake activity appear in the news often and are always accompanied by a measurement from the Richter scale. One such report can be found here: http://www.bbc.co.uk/news/world-asia-20638696. As the story says, a 7.3 magnitude earthquake struck off the coast of Japan in December of 2012, and created a small tsunami. There were six aftershocks of this quake whose Richter scale measurements are also given. The article also explains how Japan has been able to enact an early warning system that predicts the intensity of an earthquake before it causes damage. All of the calculations given in this story, and almost all others involving earthquakes, involves the use of the Richter scale logarithmic equation.

green line

D. History: What are the contributions of various cultures to this topic?

The development of logarithms saw contributions from several different countries beginning with the Babylonians (2000-1600 BC) who developed the first known mathematical tables. They also introduced square multiplication in which they simply but accurately multiplied two numbers using only addition and subtraction. Michael Stifel, of Germany, was the first mathematician to use an exponent in 1544. He developed an early version of the logarithmic table containing integers and powers of 2. Perhaps the most important contribution to logarithms came from John Napier in Scotland in 1619. He, like the Babylonians, was working with on breaking multiplication, division, and root extraction down to only addition and subtraction. Therefore, he created the “logarithm” L of a number N defined as follows:

N = 10^7 (1-10^{-7})^L

for which he wrote \hbox{NapLog}(N) = L.

 Napier’s definition of the logarithm led to the following logarithmic identities that are still taught today:

\hbox{NapLog}(\sqrt{N_1N_2}) = \frac{1}{2} (\hbox{NapLog} N_1 + \hbox{NapLog} N_2)

\hbox{NapLog}(10^{-7} N_1 N_2) = \hbox{NapLog} N_1 + \hbox{NapLog} N_2

\hbox{NapLog} \left( 10^{-7} \displaystyle \frac{N_1}{N_2} \right)= \hbox{NapLog} N_1 - \hbox{NapLog} N_2

Henry Briggs, in England, published his work on logarithms in 1624, which included logarithms of 30,000 natural numbers to the 14th decimal place worked by hand! Shortly after, back in Germany, Johannes Kepler used a logarithmic scale on a Cartesian plane to create a linear graph the elliptical shape of the cosmos.  In 1632, in Italy, Bonaventura Cavalieri published extensive tables of logarithms including the logs of trig functions (excluding cosine).  Finally, Leonhard Euler made one of the most commonly known contributions to logarithms by making the number e = 2.71828\dots the base of the natural logarithm (which was also developed by Napier). While it is untrue, as is commonly believed, that Euler invented the number 2.71828\dots, he did give it the name e. He was interested in the number because he wanted to calculate the amount that would result from continually compounded interested on a sum of money and the number 2.71828\dots kept appearing as a constant in his equation. Therefore he tied e to the natural logarithm that was not as widely used because it did not have a base.

Logarithms were developed as a result of the contributions of many cultures spanning Europe and beyond, dating back over 4000 years.

Engaging students: Defining the words acute, right, and obtuse

In my capstone class for future secondary math teachers, I ask my students to come up with ideas for engaging their students with different topics in the secondary mathematics curriculum. In other words, the point of the assignment was not to devise a full-blown lesson plan on this topic. Instead, I asked my students to think about three different ways of getting their students interested in the topic in the first place.

I plan to share some of the best of these ideas on this blog (after asking my students’ permission, of course).

This student submission again comes from my former student Jesse Faltys. Her topic: how to engage geometry students when defining the words acute, right, and obtuse.

green line

E. TECHNOLOGY: How can technology be used to effectively engage students with this topic?

ACUTE, OBTUSE, and RIGHT Angles Song

This is a great video for the end of the lesson when first introducing acute, right, and obtuse angles.  A little corny but it’s always helpful to link new knowledge to a song.  Music brings back memories or in this situation recognition.  By using creative things, you are helping the students reinforce new ideas.  Just hearing words will not help us retain the information, but adding the words to a song help reinforce the reminder for the information.  We can remember anything if we just put our minds to it.  The kids in the video are singing lyrics about right, obtuse and acute angles to the song Old McDonald Had a Farm.  The video helps the students to summarize their understanding of the three new terms and a way to retain it for future use.

http://www.watchknowlearn.org/Video.aspx?VideoID=2446

green line

D. HISTORY: How have different cultures throughout time used this topic in their society?

In Egypt as far back as 1500BC, measurements were taken of the Sun’s shadow against graduations marked on stone tables. These measurements are just different angles used to show time with some degree of accuracy.  Gromas were used for the purpose of construction in ancient Egypt.  Gromas were right-angle devices that the ancient Egyptians used when they began construction project by surveying an area. They could sketch out long lines at right angles.  The Romans will actually use the same tool to sketch out their roads.  1,713 years ago they were using right angles.  This might be important.

http://www.fig.net/pub/cairo/papers/wshs_01/wshs01_02_wallis.pdf

angles

green line

C. Culture: How has this topic appeared in pop culture (movies, TV, current music, video games, etc.)?

Angry-Birds: “Use the unique powers of the Angry Birds to destroy the greedy pigs’ fortresses!“ Angry-Birds is an app that is played by a large percentage of children on a daily basis.  Birds are positioned on a slingshot and launched at pigs that are resting on different structures.  We create a zero plane from the bird sitting in the slingshot, releasing the bird, and mark the maximum height reached. We now have an angle. The bird has created an angle with its path.  Can we classify the majority of these angles as acute, right or obtuse?

angrybirds

Bubble Shooter:  A Puzzle game that will help you stay busy for a while!

The point of the game is to remove all the spheres by matching like colors.  The “cannon” at the bottom of the page is your tool to directing the sphere were you want it to go.  You can directly shot the sphere or you can bounce off the edge of the wall.  Here is the trick, what kind of angle do you need to deliver your sphere.  One of the helpful hints from the website, “you can use the left and right border to bounce new balls in more advanced angles.” These advanced angles can be denoted as acute, right or obtuse.

http://www.shooter-bubble.com/

Engaging students: Solving exponential equations

In my capstone class for future secondary math teachers, I ask my students to come up with ideas for engaging their students with different topics in the secondary mathematics curriculum. In other words, the point of the assignment was not to devise a full-blown lesson plan on this topic. Instead, I asked my students to think about three different ways of getting their students interested in the topic in the first place.

I plan to share some of the best of these ideas on this blog (after asking my students’ permission, of course).

This student submission comes from my former student Jesse Faltys. Her topic: solving exponential equations.

green line

APPLICATIONS: What interesting (i.e., uncontrived) word problems using this topic can your students do now?

 Once your students have learned how to solve exponential equations, they can solve many different kinds of applied problems like population growth, bacterial decay, and even investment earning interest rate.    (Examples Found: http://www.education.com/study-help/article/pre-calculus-help-log-expo-applications/)

 Examples

 1. How long will it take for $1000 to grow to $1500 if it earns 8% annual interest, compounded monthly?

A = P \left( 1 + \displaystyle \frac{r}{n} \right)^{nt}

  • A (t) = 1500, P = 1000, r = 0.08, and n = 12.
  • We do not know t.
  • We will solve this equation for t and will round up to the nearest month.
  • In five years and one month, the investment will grow to about $1500.

2. A school district estimates that its student population will grow about 5% per year for the next 15 years.  How long will it take the student population to grow from the current 8000 students to 12,000?

  • We will solve for t in the equation 12,000 = 8000 e^{0.05t}.

12,000 = 8000 e^{0.05t}

1.5 = e^{0.05t}

0.05t = \ln 1.5

t = \displaystyle \frac{\ln 1.5}{0.05} \approx 8.1

  • The population is expected to reach 12,000 in about 8 years.

3. At 2:00 a culture contained 3000 bacteria.  They are growing at the rate of 150% per hour.  When will there be 5400 bacteria in the culture?

  • A growth rate of 150% per hour means that r = 1.5 and that t is measured in hours.

5400 = 3000 e^{1.5t}

1.8 = e^{1.5t}

1.5t = \ln 1.8

t = \displaystyle \frac{\ln 1.8}{1.5} \approx 0.39

  • At about 2:24 (0.39 \times 60 = 23.4 minutes) there will be 5400 bacteria.

A note from me: this last example is used in doctor’s offices all over the country. If a patient complains of a sore throat, a swab is applied to the back of the throat to extract a few bacteria. Bacteria are of course very small and cannot be seen. The bacteria are then swabbed to a petri dish and then placed into an incubator, where the bacteria grow overnight. The next morning, there are so many bacteria on the petri dish that they can be plainly seen. Furthermore, the shapes and clusters that are formed are used to determine what type of bacteria are present.

green line

CURRICULUM — How does this topic extend what your students should have learned in previous courses?

 The students need to have a good understanding of the properties of exponents and logarithms to be able to solve exponential equations.  By using properties of exponents, they should know that if both sides of the equations are powers of the same base then one could solve for x.  As we all know, not all exponential equations can be expressed in terms of a common base.  For these equations, properties of logarithms are used to derive a solution.  The students should have a good understanding of the relationship between logarithms and exponents.  Logs are the inverses of exponentials.  This understanding will allow the student to be able to solve real applications by converting back and forth between the exponent and log form.  That is why it is extremely important that a great review lesson is provided before jumping into solving exponential equations. The students will be in trouble if they have not successfully completed a lesson on these properties.

green line

TechnologyHow can technology be used to effectively engage students with this topic? 

1. Khan Academy provides a video titled “Word Problem Solving – Exponential Growth and Decay” which shows an example of a radioactive substance decay rate. The instructor on the video goes through how to organize the information from the world problem, evaluate in a table, and then solve an exponential equation. For our listening learners, this reiterates to the student the steps in how to solve exponential equations.

(http://www.khanacademy.org/math/trigonometry/exponential_and_logarithmic_func/exp_growth_decay/v/exponential-growth-functions)

2. Math warehouse is an amazing website that allows the students to interact by providing probing questions to make sure they are on the right train of thought.

For example, the question is 9^x = 27^2 and the student must solve for x.  The first “hint” the website provides is “look at the bases.  Rewrite them as a common base” and then the website shows them the work.  The student will continue hitting the “next” button until all steps are complete. This is allowing the visual learners to see how to write out each step to successfully complete the problem.

(http://www.mathwarehouse.com/algebra/exponents/solve-exponential-equations-how-to.php)

Engaging students: Box and whisker plots

In my capstone class for future secondary math teachers, I ask my students to come up with ideas for engaging their students with different topics in the secondary mathematics curriculum. In other words, the point of the assignment was not to devise a full-blown lesson plan on this topic. Instead, I asked my students to think about three different ways of getting their students interested in the topic in the first place.

I plan to share some of the best of these ideas on this blog (after asking my students’ permission, of course).

This submission comes from my former student Jesse Faltys. Her topic: how to engage students when teaching box and whisker plots.

green line

A. ApplicationsHow could you as a teacher create an activity or project that involves your topic?

Students can take a roster of a professional basketball team and create a box and whiskers plot by using the players’ stats of height and weight.  As the teacher, you can provide these numbers to them. The weight should be left in pounds, but change the height measurement to inches.  The students could be placed in groups of 3 or 4 and given different team rosters.  First, have the student calculate the minimum, maximum, lower quartile, upper quartile, and median for their roster for both the weight and height. Then, have the students place the plots on large sheets of paper and present to the class.  As the students compare their plots, they can begin to see what effects the range of data has on the construction of each box and whisker plot. Depending on the knowledge of the students you might want them to all working on the same team.  As the teacher, you can remove one player’s stats from each group effectively changing the box and whiskers plots and having the students analyzing the data’s effect on the plot constructed from the same roster.

I actually used this in a lesson during my Step II class in a middle school classroom. I used information from the Illuminations website at http://illuminations.nctm.org/LessonDetail.aspx?ID=L737.

boxwhiskergreen line

B. Curriculum – How can this topic be used in your students’ future courses in mathematics or science?

Any science course with a lab will require you to complete a formal lab write-up.  The data collected from your experiment will need to be represented in an organized manner.  The features of a box-and-whiskers plot will allow you to gather all your information and make observations off the data that your group and the class as a whole collected.  This information can be combined into one plot or the individual lab groups can be compared for any inconsistencies. A box-and-whisker plot can be useful for handling many data values. It shows only certain statistics rather than all the data. Five-number summary is another name for the visual representations of the box-and-whisker plot. The five-number summary consists of the median, the quartiles, and the smallest and greatest values in the distribution. Immediate visuals of a box-and-whisker plot are the center, the spread, and the overall range of distribution. This documentation will allow the student to make a formal analysis while putting together their formal lab write-up.

green line

E. TechnologyHow can technology be used to effectively engage students with this topic?

1. Khan Academy provides a video titled “Reading Box-and-Whisker Plots” which shows an example of a collection of data on the age of trees. The instructor on the video goes through the representations of the different parts of the structure of the box and whiskers plot.  For our listening learners, this reiterates to the student what the plot is summarizing. http://www.khanacademy.org/math/probability/descriptive-statistics/Box-and-whisker%20plots/v/reading-box-and-whisker-plots

2. Math Warehouse allows you to enter the data you are using and it will calculate the plot for you.  After having the students work on their own plots, you can have them check their work for themselves.  This will allow for immediate confirmation if the student is creating the graph correctly with the data provided.  Also, this is allowing the visual learners to see what happens to the length of the box or whiskers when changes are made to the minimum, maximum or median. http://www.mathwarehouse.com/charts/box-and-whisker-plot-maker.php#boxwhiskergraph

3. The Brainingcamp is another website that allows for interaction between the different parts of the plot and the student.  This website allows for the students to see a group of data and the matching box-and-whiskers plot.  The student can then explore by manually changing different values and instantly seeing a change in the graph.  This involvement can stimulate questions to direct the student to complete understanding of the subject.  As a hands on learner, it allows the students to manipulate the plot immediately in different “what if” situations. http://www.brainingcamp.com/resources/math/box-plots/interactive.php

Engaging students: Solving one-step and two-step inequalities

In my capstone class for future secondary math teachers, I ask my students to come up with ideas for engaging their students with different topics in the secondary mathematics curriculum. In other words, the point of the assignment was not to devise a full-blown lesson plan on this topic. Instead, I asked my students to think about three different ways of getting their students interested in the topic in the first place.

I plan to share some of the best of these ideas on this blog (after asking my students’ permission, of course).

This first student submission comes from my former student Jesse Faltys (who, by the way, was the instigator for me starting this blog in the first place). Her topic: how to engage students when teaching one-step and two-step inequalities.

green line

A. Applications – How could you as a teacher create an activity or project that involves your topic?

  1. Index Card Game: Make two sets of cards. The first should consist of different inequalities. The second should consist of the matching graph. Put your students in pairs and distribute both sets of cards.  The students will then practice solving their inequalities and determine which graph illustrates which inequality.
  2. Inequality Friends: Distribute index cards with simple inequalities to a handful of your students (four or five different inequalities) and to the rest of the students pass of cards that only contain numbers. Have your students rotate around the room and determine if their numbers and inequalities are compatible or not. If they know that their number belongs with that inequality then the students should become “members” and form a group. Once all the students have formed their groups, they should present to the class how they solved their inequality and why all their numbers are “members” of that group.

Both applications allow for a quick assessment by the teacher.  Having the students initially work in pairs to explore the inequality and its matching graph allows for discover on their own.  While ending the class with a group activity allows the teacher to make individual assessments on each student.

green line

B. Curriculum: How does this topic extend what your students should have learned in previous courses?

In a previous course, students learned to solve one- and two-step linear equations.  The process for solving one-step equality is similar to the process of solving a one-step inequality.  Properties of Inequalities are used to isolate the variable on one side of the inequality.  These properties are listed below.  The students should have knowledge of these from the previous course; therefore not overwhelmed with new rules.

Properties of Inequality

1. When you add or subtract the same number from each side of an inequality, the inequality remains true. (Same as previous knowledge with solving one-step equations)

2. When you multiply or divide each side of an inequality by a positive number, the inequality remains true. (Same as previous knowledge with solving one-step equations)

3. When you multiply or divide each side of an inequality by a negative number, the direction of the inequality symbol must be reversed for the inequality to remain true. (THIS IS DIFFERENT)

There is one obvious difference when working with inequalities and multiply/dividing by a negative number there is a change in the inequality symbol.  By pointing out to the student, that they are using what they already know with just one adjustment to the rules could help ease their mind on a new subject matter.

green line

C. CultureHow has this topic appeared in pop culture?

Amusement Parks – If you have ever been to an amusement park, you are familiar with the height requirements on many of the rides.  The provide chart below shows the rides at Disney that require 35 inches or taller to be able to ride. What rides will you ride?

(Height of Student \ge  Height restriction)

Blizzard Beach Summit Plummet 48″
Magic Kingdom Barnstormer at Goofy’s Wiseacres Farm 35″
Animal Kingdom Primeval Whirl 48″
Blizzard Beach Downhill Double Dipper 48″
DisneyQuest Mighty Ducks Pinball Slam 48″
Typhoon Lagoon Bay Slide 52″
Animal Kingdom Kali River Rapids 38″
DisneyQuest Buzz Lightyear’s AstroBlaster 51″
DisneyQuest Cyberspace Mountain 51″
Epcot Test Track 40″
Epcot Soarin’ 40″
Hollywood Studios Star Tours: The Adventures Continue 40″
Magic Kingdom Space Mountain 44″
Magic Kingdom Stitch’s Great Escape 40″
Typhoon Lagoon Humunga Kowabunga 48″
Animal Kingdom Expedition Everest 44″
Blizzard Beach Cross Country Creek 48″
Epcot Mission Space 44″
Hollywood Studios The Twilight Zone Tower of Terror 40″
Hollywood Studios Rock ‘n’ Roller Coaster Starring Aerosmith 48″
Magic Kingdom Splash Mountain 40″
Magic Kingdom Big Thunder Mountain Railroad 40″
Animal Kingdom Dinosaur 40″
Epcot Wonders of Life / Body Wars 40″
Blizzard Beach Summit Plummet 48″
Magic Kingdom Barnstormer at Goofy’s Wiseacres Farm 35″
Animal Kingdom Primeval Whirl 48″
Blizzard Beach Downhill Double Dipper 48″
DisneyQuest Mighty Ducks Pinball Slam 48″
Typhoon Lagoon Bay Slide 52″

Sports – Zdeno Chara is the tallest person who has ever played in the NHL. He is 206 cm tall and is allowed to use a stick that is longer than the NHL’s maximum allowable length. The official rulebook of the NHL state limits for the equipment players can use.  One of these rules states that no hockey stick can exceed160 cm.  (Hockey stick \le 160 cm) The world’s largest hockey stick and puck are in Duncan, British Columbia. The stick is over 62 m in length and weighs almost 28,000 kg.  Is your equipment legal?

hockey

Weather – Every time the news is on our culture references inequalities by the range in the temperature throughout the day.  For example, the most extreme change in temperature in Canada took place in January 1962 in Pincher Creek, Alberta. A warm, dry wind, known as a chinook, raised the temperature from -19 °C to 22 °C in one hour. Represent the temperature during this hour using a double inequality. (-19 < the temperature < 22) What Inequality is today from the weather in 1962?