A sphere is divided into regions by 9 planes that are passing through its center. What is the largest possible number of regions that are created on its surface?
a.
b.
c. 81
d. 76
e. 74
This series was actually written by my friend Jeff Cagle, department head for mathematics at Chapelgate Christian Academy, as he tried technique after technique to solve this problem. I thought that his resolution to the problem was an excellent example of the process of mathematical problem-solving, and (with his permission) I am posting the process of his solution here. (For the record, I have no doubt that I would not have been able to solve this problem.)
OK, so I wanted to prove that each region would be a triangle. So I decided to project the sphere onto a plane. There’s a standard way of doing that, used both by map-makers and mathematicians. Place the sphere with the south pole on the plane at the origin. Then for each point on the sphere, run a line from the north pole through that point to the plane. This gives a 1-1 mapping of sphere to plane. The diagram below shows this mapping, with the points A and B on the sphere mapping to the points A’ and B’ on the plane respectively.
Notice that in the mapping above, the south pole is mapped to the origin (“straight down”), while the north pole itself cannot be mapped. We call the north point the “point at infinity.” Also notice that the equator gets mapped to a circle. And, any circle around the sphere that goes through the north pole will also go through the south pole, and so becomes a line in the plane.
A sphere is divided into regions by 9 planes that are passing through its center. What is the largest possible number of regions that are created on its surface?
a.
b.
c. 81
d. 76
e. 74
This series was actually written by my friend Jeff Cagle, department head for mathematics at Chapelgate Christian Academy, as he tried technique after technique to solve this problem. I thought that his resolution to the problem was an excellent example of the process of mathematical problem-solving, and (with his permission) I am posting the process of his solution here. (For the record, I have no doubt that I would not have been able to solve this problem.)
AHH! Insight! Each plane must intersect the others because they all pass through the center. And two planes intersect in a line. And the line must intersect the sphere at two points. SO, we can count intersection points: There are 9 planes, and each plane will intersect the other 8, so there are 9 ∗ 8 = 72 intersection points IF we arrange the planes for maximum regions. More generally, if we have n planes arranged for max intersection points, we will have 𝑛(𝑛 − 1) intersection points.
Wait, let’s do this carefully. There are 9 planes, and they can each intersect 8 different planes; but that counts the intersections of plane A and plane B twice, so there are (9*8)/2 = 36 lines of intersection, but 36 ∗ 2 = 72 points of intersection with the sphere. So our problem just got narrower: Given 72 intersection points defining various regions on the sphere, how many regions do we get?
And that’s where the problem stands as of this writing. My preliminary conjecture is that each region will be a “triangle” (officially, spherical triangle) on the surface of the sphere, especially if we are maximizing regions. I need to prove that conjecture and then count triangles, which shouldn’t be too hard.
A sphere is divided into regions by 9 planes that are passing through its center. What is the largest possible number of regions that are created on its surface?
a.
b.
c. 81
d. 76
e. 74
This series was actually written by my friend Jeff Cagle, department head for mathematics at Chapelgate Christian Academy, as he tried technique after technique to solve this problem. I thought that his resolution to the problem was an excellent example of the process of mathematical problem-solving, and (with his permission) I am posting the process of his solution here. (For the record, I have no doubt that I would not have been able to solve this problem.)
At this point, various methods suggested themselves. Perhaps we could use recursion: let be the regions created by planes, and then we could examine the number of additional regions formed by planes?
Or, related to this, perhaps we needed to find the number of intersection points of each of the planes, and then relate the number of intersection points to the number of regions. But how to describe the intersection points?
It did occur to me that if we have n planes situated for maximal regions, they will divide the equator up into subintervals, and adding another plane will divide up two of those subintervals into 4. Did that help? Well, it could help count the number of regions touching the equator: two for each subinterval (one north of equator, one south). But what about the regions not touching the equator? Hmph.
One possible way to visualize this problem is to project the plane onto a sphere. I know how to
do that, but counting the regions still seems hard.
For a while, I toyed with the situation where we have
Plane 1 – equator (this always happens: Just make plane 1 the equator) 𝑃1(0𝑁, 0𝐸).
Plane 2 – Prime Meridian 𝑃2(90𝑁, 0𝐸)
Plane 3 – Intl Date Line 𝑃3(90𝑁, 90𝐸)
Plane 4 – at an angle to all of those 𝑃4(45𝑁, 45𝐸)
I looked at my daughter’s wall map of the world: P4 goes through Tblisi Georgia and south of French Polynesia.
Where does P4 intersect the others? Could I make a formula to find the intersection points?
A sphere is divided into regions by 9 planes that are passing through its center. What is the largest possible number of regions that are created on its surface?
a.
b.
c. 81
d. 76
e. 74
This series was actually written by my friend Jeff Cagle, department head for mathematics at Chapelgate Christian Academy, as he tried technique after technique to solve this problem. I thought that his resolution to the problem was an excellent example of the process of mathematical problem-solving, and (with his permission) I am posting the process of his solution here. (For the record, I have no doubt that I would not have been able to solve this problem.)
On my first pass, all I could do was to visualize the first three planes, one at the equator, one passing through the prime meridian in Greenwich England, and one passing through the International Date Line. That gave me regions, so my preliminary conjecture was “b. ”. But I couldn’t prove it. And when I tried to mentally add a fourth plane to my diagram – one starting in Ukraine or something and hitting the equator halfway between the others – I found that I couldn’t clearly see that plane and count the regions formed. That vexed me for a while, and I put it away for the day.
The next day, I realized that I wasn’t going to be able to picture these planes, and I needed to find a way to describe their directions mathematically. The picture I had was of the equatorial plane and a second plane passing through it in the center. That second plane could be rotated any amount around the equator – described by one angle – and then elevated by tilting to a different angle. So I conjectured that two angles uniquely describe each plane: 𝜃 to describe angle around and 𝜙 to describe angle of elevation.
In the shower, I realized that I had just rediscovered latitude and longitude! That made me feel much better about my mathematical description as likely correct.
But now, how to turn the mathematical description into a solution? If I have one plane at (𝜃1,𝜙1), how do I count the regions it creates with the other planes?
In my capstone class for future secondary math teachers, I ask my students to come up with ideas for engaging their students with different topics in the secondary mathematics curriculum. In other words, the point of the assignment was not to devise a full-blown lesson plan on this topic. Instead, I asked my students to think about three different ways of getting their students interested in the topic in the first place.
I plan to share some of the best of these ideas on this blog (after asking my students’ permission, of course).
This student submission comes from my former student Lisa Sun. Her topic, from Precalculus: using Pascal’s triangle.
How could you as a teacher create activity or project that involves your topic?
To introduce Pascal’s Triangle, I would create an activity where it involves coin tossing. I want to introduce them with coin tossing first before bringing in binomial expansions (or any other uses) because coin tossing are much more familiar to majority, if not all, students. Pascal’s Triangle can show you the probability of any combination of coin tossing (aka binomial distribution). Below are a few of the results and how they compare with Pascal’s Triangle:
Afterwards, I would ask the students guiding questions if they see anything interesting about the numbers that we gathered. I want them to notice that each number is the numbers directly above it added together (Ex: 1 + 2 = 3) and how those three numbers form a triangle hence, Pascal’s Triangle.
B2: How does this topic extend what your students should have learned in previous courses?
In previous courses, students should have already learned about binomial expansions. (Ex: (a+b)2 = a2+ 2ab + b2). This topic extends their prior knowledge even further because Pascal’s Triangle displays the coefficients in binomial expansions. Below are a few examples in comparison with Pascal’s Triangle:
If any of the students are having difficulties expanding any of the binomials or remembering the formula, they can remember Pascal’s Triangle. Using the Pascal’s Triangle for solving binomial expansions can aid the students when it comes to being in a stressful environment (ex: taking a test). Making a connection between their prior knowledge on binomial expansion and Pascal’s Triangle, I believe it would give the students a deeper understanding as to how Pascal’s Triangle was formed.
C2: How has this topic appeared in high culture?
There’s a computer scientist, John Biles, at Rochester University in New York State who used the series of Fibonacci numbers to make a piece of music. How do the Fibonacci numbers relate to Pascal’s Triangle you ask? Well, observe the following:
As you can see, the sum of the numbers diagonally gives you the Fibonacci numbers (a series of numbers in which each number is the sum of the two preceding numbers).
John Biles composed a piece called PGA -1 which is based on a Fibonacci sequence. Note that on a piano, from middle C to a one octave C, there are a total of eight white keys (a Fibonacci number). Also, when you do a chromatic C scale which includes all the black keys, there are a total of five black keys (another Fibonacci number) which are also separated in a group of two and three black keys (see the pattern?). When you’re creating chords, let’s take the C chord for example, it consists of the notes C, E, and G. Notice that harmonizing notes are coming from the third note and the fifth note of the whole C scale. So following similar ideas on the use of these numbers/sequences, John Biles was able to compose music.
The following may be a bit extra, but I also want to include this youtube link of this blogger who was very precise and compared the sequences to current pop music:
[I found this to be super interesting!]
How have different cultures throughout time used this topic in their society?
Hundreds of years before Blaise Pascal (mathematician whom Pascal’s Triangle was named after), many mathematicians in different societies applied their knowledge of the Triangle.
Indian mathematicians used the array of numbers to represent short and long sounds in poetic meters in their chants and conversations. A Chinese mathematician, Chu Shih Chieh, used the triangle for binomial expansions. Music composers, like Mozart and Debussy, used the sequence to compose their music to guide them what notes to play that would be pleasing to the audience. In the past, arithmetic composing was frowned upon however contemporary music to this day is now filled with them. When Pascal’s work on the triangle was published, society began to apply the knowledge of the Triangle towards gambling with dice. In the end, all cultures began to use Pascal’s Triangle similarly in their daily lives.
How can technology be used to effectively engage students with this topic?
The Youtube video above is a great tool for students who are visual learners. This video is to the point and clear with the message as to what Pascal’s Triangle is, the uses of it, and who aided in the discovery of it. I also believe the characters that were being used in this video would be appealing to students. This video was filled with facts that I want my students to know therefore, I would like them to follow along and write down important facts about Pascal’s Triangle. I would like to conclude that technology can be a “force multiplier” for all teachers in their classroom. Instead of having the teacher being the only source of help in a classroom, students can access web site, online tutorials, and more to assist them. What’s great is that students can access this at any time. Therefore, they can re-watch this video again once they’re home when they need a refresher or didn’t understand something the first time.
In my capstone class for future secondary math teachers, I ask my students to come up with ideas for engaging their students with different topics in the secondary mathematics curriculum. In other words, the point of the assignment was not to devise a full-blown lesson plan on this topic. Instead, I asked my students to think about three different ways of getting their students interested in the topic in the first place.
I plan to share some of the best of these ideas on this blog (after asking my students’ permission, of course).
This student submission comes from my former student Daniel Herfeldt. His topic, from Precalculus: using Pascal’s triangle.
A great activity for Pascal’s triangle would be to first have the students find a pattern of odds and evens. The first thing that you would do is to print out blank Pascal’s triangle. You would give each student a paper for them to fill out. They would have to first fill out the triangle themselves. This would give them practice on which numbers to add as well as further see a pattern of what the next one would potentially look like. After they finish, they would have to color in all of the odd numbers a certain color, and followed by coloring all of the even ones a different color. From here, they will see that once you color it is, the even numbers will make an upside down triangle. Next to the biggest triangles, you will see smaller triangles. An example is shown below. When the students have finished, you will show them why it is like that. Then explain what the name of the colored triangle is, which is called the Sierpinski Triangle.
Pascal’s Triangle is used all over mathematics. It is mainly recognized as how to find the coefficients of binomials, as well as a lot of other uses for binomials. What students and many other people do not know, is that this triangle can be used for much more. For example, you are able to use Pascal’s triangle to find the Fibonacci sequence. Although it may be a little harder to find than the coefficients of binomials, it is still possible. If you add up the numbers in a diagonal pattern from right to left, you will be able to find the Fibonacci sequence. Below will be a picture of how this is implemented. Another way that this will help in future courses is that it allows you to find squares of a number easily. If you look at the 3rd diagonal row, adding two consecutive numbers from left to right will give the square of a number. A picture of this will also be posted below. Another way that this is implemented in future courses is statistics and probability. This triangle can be used to find the probability of many different things. This is only a few ways that the triangle can be used in future courses, considering that there are plenty of other ways it can be used. In all, this is a very important topic for someone that is pursuing mathematics.
Fibonacci sequence:
Triangular numbers:
This video would be a great way to either start a lesson on Pascal’s Triangle or to review the lesson before a test. The video shows different ways that you can implement the triangle to solve different things in mathematics. If this was the video to start the lesson, I would have each student take out a notebook and writing utensil while watching the video. Throughout the video the students would have to find at least three different ways a person may use Pascal’s triangle that they found particularly interesting. This should lead to most of the ways to be picked by at least one student. After they share their answers, explain further why these work. This could make students more intrigued with the subject. If the video was for a review of the topic, I would also have the students have out a writing utensil and a notebook. For this instance, I would have each individual write down what they had forgotten about Pascal’s triangle. From here the teacher will review the points that were most forgotten, serving as a review.
In this series, I’m compiling some of the quips and one-liners that I’ll use with my students to hopefully make my lessons more memorable for them.
Here’s a problem that might arise in my discrete mathematics class:
Find the negation of .
This requires a couple of reasonably complex steps. First, we use the fact that is logically equivalent to $\lnot p \lor q$:
.
Next, we have to apply DeMorgan’s Law to find the negation:
Finally, we arrive at the final step: simplifying . At this point, I tell my class, it’s a bit of joke, especially after the previous, more complicated steps. “Not not ,” of course, is the same as . So this step is a bit of a joke. Which steps up the following cringe-worthy pun:
In fact, you might even call this a not-not joke.
After the groans settle down, we finish the derivation:
In this series, I’m compiling some of the quips and one-liners that I’ll use with my students to hopefully make my lessons more memorable for them.
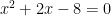
Today’s quip is something that I’ll use to emphasize that the meaning of the word “or” is a little different in mathematics than in ordinary speech. For example, in mathematics, we could solve a quadratic equation for :
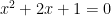
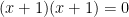
In this example, the word “or” means “one or the other or maybe both.” It could be that both statements are true, as in the next example:
However, in plain speech, the word “or” typically means “one or the other, but not both.” Here the quip I’ll use to illustrate this:
At the end of “The Bachelor,” the guy has to choose one girl or the other. He can’t choose both.
In this series, I’m compiling some of the quips and one-liners that I’ll use with my students to hopefully make my lessons more memorable for them.
When I was a student, I heard the story (probably apocryphal) about the mathematician who wrote up a mathematical paper that was hundreds of pages long and gave it to the departmental administrative assistant to type. (This story took place many years ago before the advent of office computers, and so typewriters were the standard for professional communication.) The mathematician had written “iff” as the standard abbreviation for “if and only if” since typewriters did not have a button for the symbol.
Well, so the story goes, the administrative assistant saw all of these “iff”s, muttered to herself about how mathematicians don’t know how to spell, and replaced every “iff” in the paper with “if”.
And so the mathematician had to carefully pore through this huge paper, carefully checking if the word “if” should be “if” or “iff”.
I have no idea if this story is true or not, but it makes a great story to tell students.


 be the regions created by
  planes, and then we could examine the number of additional regions formed by
  planes?
 subintervals, and adding another plane will divide up two of those subintervals into 4. Did that help? Well, it could help count the number of regions touching the equator: two for each subinterval (one north of equator, one south). But what about the regions not touching the equator? Hmph.
 regions, so my preliminary conjecture was “b.


 .
. .
.
 . At this point, I tell my class, it’s a bit of joke, especially after the previous, more complicated steps. “Not not
  ,” of course, is the same as
  .
. :
:


 symbol.