Source: https://xkcd.com/2286/
Source: https://xkcd.com/2286/
Source: https://xkcd.com/2327/
In my capstone class for future secondary math teachers, I ask my students to come up with ideas for engaging their students with different topics in the secondary mathematics curriculum. In other words, the point of the assignment was not to devise a full-blown lesson plan on this topic. Instead, I asked my students to think about three different ways of getting their students interested in the topic in the first place.
I plan to share some of the best of these ideas on this blog (after asking my students’ permission, of course).
This student submission again comes from my former student Eduardo Torres Manzanarez. His topic, from Algebra: fitting data to a quadratic function.

How could you as a teacher create an activity or project that involves your topic?
One interesting project that could be done to invoke quadratic modeling is for students to develop a model that fits a business’ data of labor and output. The basic model of labor and output for a given company can be modeled by a quadratic function and it can be used to determine important figures such as the maximum output, minimum output, maximum labor, and minimum labor. The following image is an example of such a relationship.

In general, people would think that the more labor and resources used at the exact same time results in more product. If you have more product produced, then you accumulate more profit. These ideas are not wrong to be thought of but a key aspect that is missed in the thought process is that of land or otherwise known as workspace. The more employees you hire, the more space required so that these individuals can produce but space is limited just like any other resource. Lack of space inhibits production flow and therefore decreases product, decreases profits, and increases cost through increased wages. All of this does not occur until you pass the maximum of the model. So, both of these behaviors are shown and exhibited by a quadratic function. Students can realize these notions of labor and production by analyzing data of various companies. An activity that could show such a relationship in action is having one student create a small particular product such as a card with a particular design and produce as many as they can in a certain amount of time, with certain resources, and a workspace. Record the number of cards produced. Next, have two students create cards with the exact same time, resources, and workspace and record the amount produced. As more students are involved, the behavior of labor and production will be shown to be direct and then inverse to each other. The final piece for this activity would be for students to find realize what function seems to have the same shape as the data on a graph and for them to manipulate the function so that it fits on the data. Turns out the function will have to be a quadratic function.
B1) How can this topic be used in your students’ future courses in mathematics or science?
Fitting data onto a quadratic function is useful in analyzing behavior between variables. In various mathematical courses, data is provided but in science usually one must come up with data through an experiment. Particularly there are many situations in physics where this is the case and relationships have to be modeled by fitting data onto various functions. Doing quadratic modeling and even linear modeling early on is a good introduction into other models that are used in the many fields of science. Not every experiment is recorded perfectly and hence there can never be a perfect model. Through analytical skills presented in this topic, it scaffolds students to find a model for bacteria growth, a model for velocity, a model for the position of an object, and a model for nuclear decay in the future and what to expect the behavior of these models to be. This topic in combination with limits from calculus builds onto piece-wise models for probability and statistics.
E1) How can technology be used to effectively engage students with this topic?
Technology such as graphing calculators, Excel, Desmos, and TI-Nspires can be used to create the best model possible based on least-squares regression. This technology is engaging in developing models, not because of the lack of convoluted math that deals with squaring differences but rather the focus on analyzing particular models such as a quadratic model. They could be engaging for students when students can input particular sets of data they find interesting and need a way to model it. Furthermore, students can use technology to develop beautiful graphs that can be easily interpreted than rough sketches of these models. TI-Nspire software can be used by a teacher to send a particular data set to students and their own TI-Nspires. Students can then insert a quadratic function on the graphing application and manipulate the function by changing its overall shape by the mouse cursor. This allows students to dictate their own particular models and allows for comparison between models as to which is more accurate for particular data.
References
https://study.com/academy/lesson/production-function-in-economics-definition-formula-example.html
In my capstone class for future secondary math teachers, I ask my students to come up with ideas for engaging their students with different topics in the secondary mathematics curriculum. In other words, the point of the assignment was not to devise a full-blown lesson plan on this topic. Instead, I asked my students to think about three different ways of getting their students interested in the topic in the first place.
I plan to share some of the best of these ideas on this blog (after asking my students’ permission, of course).
This student submission comes from my former student Andrew Sansom. His topic, from Algebra II: solving linear systems of equations with matrices.
A1. What interesting (i.e., uncontrived) word problems using this topic can your students do now? (You may find resources such as http://www.spacemath.nasa.gov to be very helpful in this regard; feel free to suggest others.)
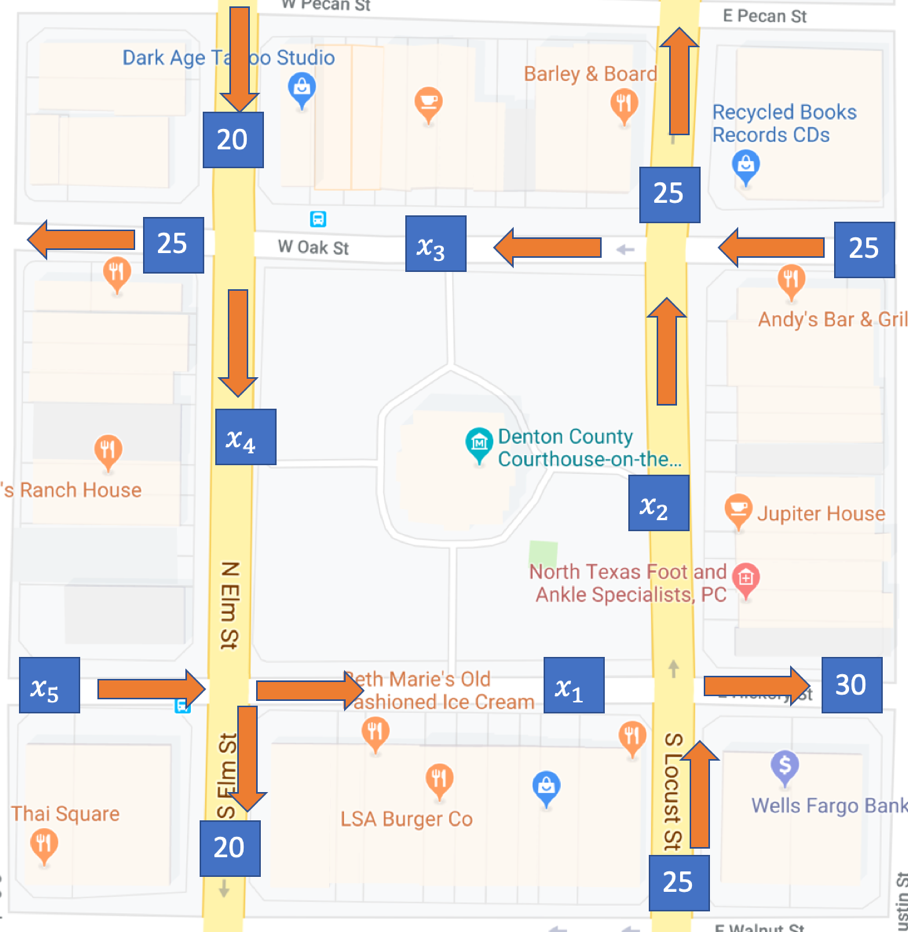
The Square in Downtown Denton is a popular place to visit and hang out. A new business owner needs to decide which road he should put an advertisement so that the most people will see it as they drive by. He does not have enough resources to traffic every block and street, but he knows that he can use algebra to solve for the ones he missed. In the above map, he put a blue box that contains the number of people that walked on each street during one hour. Use a system of linear equations to determine how much traffic is on every street/block on this map.
HINT: Remember that in every intersection, the same number of people have to walk in and walk out each hour, so write an equation for each intersection that has the sum of people walking in is equal to the number of people walking out.
HINT: Remember that the same people enter and exit the entire map every hour. Write an equation that has the sum of each street going into the map equal to the sum of each street going out of the map.
Solution:
1. Build each equation, as suggested by the hints.
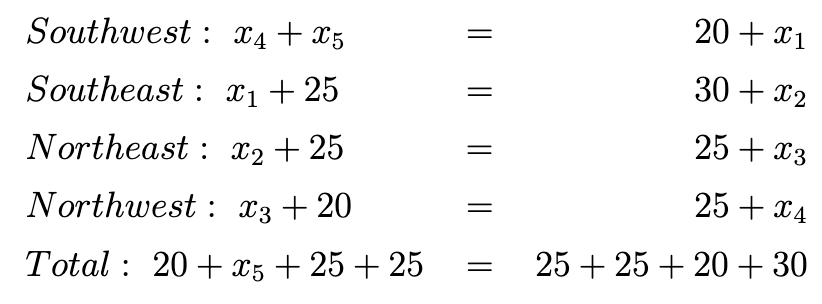
2. Rewrite the system of simultaneous linear equations in standard form.

3. Rewrite the system as an augmented matrix
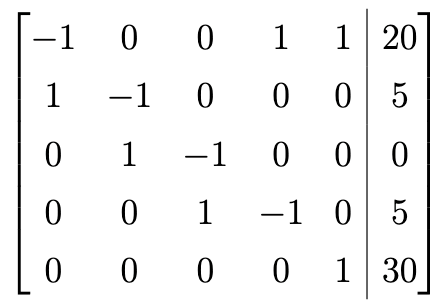
4. Reduce the system to Reduced Row Echelon Form (using a calculator)
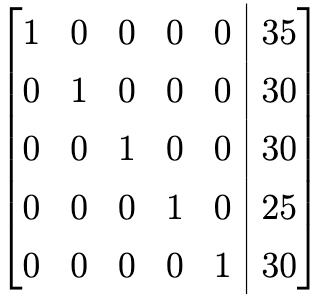
5. Use this reduced matrix to find solutions for each variable
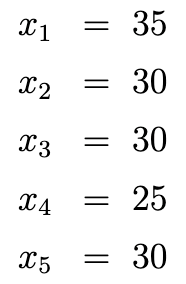
This gives us a completed map:

Clearly, the business owner should advertise on Hickory Street between Elm and Locust St (Possibly in front of Beth Marie’s).
B1. How can this topic be used in your students’ future courses in mathematics or science?
Systems of Simultaneous Linear Equations appear frequently in most problems that involve modelling more than one thing at a time. In high school, the ability to use matrices to solve such systems (especially large ones) simply many problems that would appear in AP or IB Physics exams. Circuit Analysis (including Kirchhof’s and Ohm’s laws) frequently amounts to setting up large systems of simultaneous equations similar to the above network traffic problem. Similarly, there are kinematics problems where multiple forces/torques acting on an object that naturally lend themselves to large systems of equations.
In chemistry, mixture problems can be solved using systems of equations. If more than substance is being mixed, then the system can become too large to efficiently solve except by Gaussian Elimination and matrix operations. (DeFreese, n.d.)
At the university level, learning to solve systems using matrices prepares the student for Linear Algebra, which is useful in almost every math class taken thereafter.
D4. What are the contributions of various cultures to this topic?
Simultaneous linear equations were featured in Ancient China in a text called Jiuzhang Suanshu or Nine Chapters of the Mathematical Art to solve problems involving weights and quantities of grains. The method prescribed involves listing the coefficients of terms in an array is exceptionally similar to Gaussian Elimination.
Later, in early modern Europe, the methods of elimination were known, but not taught in textbooks until Newton published such an English text in 1720, though he did not use matrices in that text. Gauss provided an even more systematic approach to solving simultaneous linear equations involving least squares by 1794, which was used in 1801 to find Ceres when it was sighted and then lost. During Gauss’s lifetime and in the century that followed, Gauss’s method of elimination because a standard way of solving large systems for human computers. Furthermore, by adopting brackets, “Gauss relieved computers of the tedium of having to rewrite equations, and in so doing, he enabled them to consider how to best organize their work.” (Grcar J. F., 2011).
The use of matrices in elimination appeared in 1895 with Wilhelm Jordan and 1888 by B.I. Clasen. Since then, the method we use today has become commonly attributed to Jordan and commemorated with the name “Gauss-Jordan Method”.
References:
DeFreese, C. (n.d.). Mixture Problems. Retrieved from University of Missouri-St. Louis–Department of Mathematics and Computer Science: http://www.umsl.edu/~defreeseca/intalg/ch8extra/mixture.htm
Grcar, J. F. (2011, May). Historia Mathematica–How ordinary elimination became Gaussian elimination. Retrieved from ScienceDirect: https://www.sciencedirect.com/science/article/pii/S0315086010000376
Grcar, J. F. (n.d.). Mathematics of Gaussian Elimination. Retrieved from American Mathematical Society: https://www.ams.org/notices/201106/rtx110600782p.pdf
In my capstone class for future secondary math teachers, I ask my students to come up with ideas for engaging their students with different topics in the secondary mathematics curriculum. In other words, the point of the assignment was not to devise a full-blown lesson plan on this topic. Instead, I asked my students to think about three different ways of getting their students interested in the topic in the first place.
I plan to share some of the best of these ideas on this blog (after asking my students’ permission, of course).
This student submission again comes from my former student Cody Luttrell. His topic, from Algebra: graphing parabolas.
How can this topic be applied in your students’ future courses in mathematics or science?
Understanding the graph of a parabola will be very important in an Algebra 1 students future math and science classes. When a student enters Algebra II, they will be dealing with more complicated uses dealing with quadratic functions. An example would be complex numbers. When dealing with a parabola that does not cross the x-axis, you will end up with an imaginary solution, but if the student does not understand the graph of a parabola they may not understand this topic. When the student reaches pre-calculus, understanding the transformations of a parabola will aid when dealing with transformations of other functions such as cubic, square root, and absolute value.
Understanding the graph of a parabola will benefit a student in Physics when they deal with equations of projectiles. Knowing that there is symmetry in a parabola can aid in knowing the position of the projectile at a certain time if they know the time the projectile is at its maximum height.
How has this topic appeared in high culture (art, classical music, theatre, etc.)?
The shape of the parabola is used constantly in art and even architecture. A quick engage that I can have for the students would be a powerpoint of photos of parabolas in the real world. Examples would include arches in bridges, roller coasters, water fountains, etc. Ideally, I would want my students to see the pattern that I am getting at and see the parabola in all of these objects. I could then ask the students to brainstorm where else they can find this shape. I would expect to hear answers such as the St. Louis Arch, the sign at McDonalds, or even a rainbow.
After learning about quadratics, we could come back to the topic of architecture and parabolas. After they have learned about the transformations of parabolas, we can discuss how to make arch longer or shorter in bridges(if it follows the parabolic shape). We could also discuss how if we wanted to make a bridge taller, how it would affect the distance between the legs of the bridge.
Using Technology.
A great video from Youtube to show the students to introduce them to graphing parabola: https://www.youtube.com/watch?v=E_0AHIaK48A
In the video, it shows how parabolas are even used in famous videogames such as Mario Bros. In the video, you see a few clips of Mario and Luigi jumping over enemies. The video outlines the path that he jumped and you can notice that it is in the shape of a parabola. The video then goes into explanation that Mario if following the path of y=-x^2. After this explanation, the video switches to Luigi. When Luigi jumps, he also follows the form of a parabola, but slightly different then the way Mario jumps. Luigi can jump higher than Mario, but not as far. The video then states that Luigi is following the path of y=-1.5x^2. This can introduce the idea of compression and stretches. The video than continues on with other examples of how parabolas are used within the game such as vertical shifts.
In my capstone class for future secondary math teachers, I ask my students to come up with ideas for engaging their students with different topics in the secondary mathematics curriculum. In other words, the point of the assignment was not to devise a full-blown lesson plan on this topic. Instead, I asked my students to think about three different ways of getting their students interested in the topic in the first place.
I plan to share some of the best of these ideas on this blog (after asking my students’ permission, of course).
This student submission comes from my former student Haley Higginbotham. Her topic, from Algebra: completing the square.
A2. How could you as a teacher create an activity or project that involves your topic?
To start the activity, I think I would do some examples of how to complete the square and see if anybody notices a pattern in how it is done. If not, I would give them some hints and some time to think about it more deeply, and maybe give them a few more examples to do depending on time and number of previous examples. After they have figured out the pattern, I would ask them if they knew why it worked to add (b/2)^2, and why they need to both add and subtract it. Then, we would go into the second part of the activity, which would require manipulatives. They would get into partners and model different completing the square problems with algebra tiles, and explain both verbally and in writing why adding (and subtracting) (b/2)^2 works to complete the square. I would probably also ask if you could “complete the cube,” and have them justify their answer as an elaborate.
B1. How can this topic be used in your students’ future courses in mathematics?
Completing the square is a fairly nifty trick that pops up a decent bit in Calculus 2, particularly in taking integrals of trig functions. Since they need to be in the specific form of (x+a)^2, or some variation thereof. If a student didn’t know how to complete the square, they would get stuck on how to integrate that type of problem. In addition, completing the square is useful when you want to transform a quadratic equation into the vertex form of the equation. It also could have applications in partial fraction decomposition if you are trying to simplify before doing the partial fraction decomposition, and has applications in Laplace transforms through partial fraction decomposition. It is also helpful in solving quadratic equations if it’s not obviously factorable and the quadratic equation is useful but can be tedious to use, especially if you don’t remember how to simplify radicals.
B2. How does this topic extend what your students have learned in previous courses?
Students typically learn, or at least have heard of, the quadratic formula before they have learned completing the square. Completing the square can be used to derive the quadratic formula, so they get more of an idea of why it works as opposed to just memorizing the formula. Also, if a student is having trouble remembering what exactly the quadratic formula is, they can use completing the square to re-derive it fairly quickly. Also, it ties the concepts of what they are learning together more so they are more likely to remember what they learned and less likely to see the quadratic formula and completing the square as two random pieces of mathematical information. Depending on the grade level, completing the square can also extend the idea of rewriting equations. They might have been familiar with turning point-slope form into slope intercept form, but not turning what is sometimes the standard form (the quadratic form) into the vertex form of the equation.
In my capstone class for future secondary math teachers, I ask my students to come up with ideas for engaging their students with different topics in the secondary mathematics curriculum. In other words, the point of the assignment was not to devise a full-blown lesson plan on this topic. Instead, I asked my students to think about three different ways of getting their students interested in the topic in the first place.
I plan to share some of the best of these ideas on this blog (after asking my students’ permission, of course).
This student submission again comes from my former student Biviana Esparza. Her topic, from Algebra: solving absolute value equations.
B2. How does this topic extend what your students should have learned in previous courses?
One of the things that I love about math is that it all builds up on itself. Absolute value is first introduced in sixth grade, where they just have to determine the absolute value of a number. Given |-4|, the answer is 4, |5|=5, |-16|=16, and so on. In seventh grade, students are expected to be able to use the operations on numbers, such as multiply, add, subtract, and divide. In eighth grade, students should be able to write one variable equations; all lead up to learning how to solve absolute value equations in algebra 2.
C1. How has this topic appeared in pop culture (movies, TV, current music, video games, etc.)?
How I Met Your Mother is a TV show that aired from 2005 to 2014 on CBS. It is a very popular show to watch on Netflix. In the show’s second to last episode, titled “Last Forever, Part 1,” Marshall Eriksen is asked about his new job, and all of his responses are positive but sound slightly awkward. His wife Lily then explains that Marshall decided to only say positive things about his new job now that he is back in corporate law.
This scene could be used to engage students before a lesson on absolute value equations because the two are sort of related in that with every input, there is a positive output. After watching the scene, the teacher could explain how absolute value equations usually require you to break them up into a positive and negative solution and continue to solve. The positive answer is more straight forward to solve for, and the negative answer probably requires more thought and steps, similar to Marshall having to answer cautiously and slowly when trying to answer in a positive way in the scene.
E1. How can technology be used to effectively engage students with this topic?
If the students have access to laptops or tablets or the teacher has access to a class set, Desmos has a nice teacher program and one of the lessons on the site scaffolds student knowledge on distances on number lines all the way up to solving absolute value functions using number lines. The link is provided below. This lesson would be engaging for students because many of them are usually drawn to projects or lessons involving technology. Also, the virtual, interactive lesson does a good job of scaffolding, starting from basic number line knowledge which the students should all be starting with.
https://teacher.desmos.com/activitybuilder/custom/59a6c80e7620f30615d2b566
In my capstone class for future secondary math teachers, I ask my students to come up with ideas for engaging their students with different topics in the secondary mathematics curriculum. In other words, the point of the assignment was not to devise a full-blown lesson plan on this topic. Instead, I asked my students to think about three different ways of getting their students interested in the topic in the first place.
I plan to share some of the best of these ideas on this blog (after asking my students’ permission, of course).
This student submission again comes from my former student Andrew Cory. His topic, from Algebra: parallel and perpendicular lines.
A2. How could you as a teacher create an activity or project that involves your topic?
An activity can be done with students by giving them a map, with a series of roads that run perpendicular or parallel to each other, asking them to identify pairs of perpendicular and parallel roads. To go beyond this, students can then find the slopes of a set of perpendicular or parallel lines on their own, then be asked to identify how they relate to one another. This will eventually lead them to being able to come up with a general rule to finding lines that are perpendicular or parallel to each other. Students can then be asked to create their own streets that will be perpendicular or parallel to some of the streets given. After this, students should be confident going from the representational model of perpendicular and parallel lines to graphing them on a cartesian plane.
B2. How does this topic extend what your students should have learned in previous courses?
Studying perpendicular and parallel lines builds on a student’s knowledge of being able to calculate equations of lines and slopes given different amounts of initial information. It extends their knowledge of calculating slopes, and allows them to do it in reverse. Instead of getting two points to find the slope of the line, they may be given one point and the equation of a perpendicular or parallel line. This allows students to extend and apply their knowledge of linear equations, and gives them more situations to apply it to. This can then be extended to more challenging word problems, challenging students to come up with issues that require related slopes.
E1. How can technology be used to effectively engage students with this topic?
Desmos can be very useful with engaging students in anything related to geometry or graphs. There are many resources within the website beyond just graphing two lines and viewing the relationship. A teacher can create their own activities within the website to allow students to explore a concept such as perpendicular and parallel lines, or they could use a pre-existing one created and shared by another educator. These activities give a great visual model of how perpendicular and parallel lines look, and then allow it for students to easily get the equations for each of the lines. Using Desmos can give students the capabilities of generating formulas and relationships on their own, without needing to be told what they are from their teachers. This will allow students a quicker path to mastery of the topic, and will lead them to applying it in a wider variety of areas more quickly than a student who is just told that slopes of parallel lines are equal and slopes of perpendicular lines are opposite reciprocals.
In my capstone class for future secondary math teachers, I ask my students to come up with ideas for engaging their students with different topics in the secondary mathematics curriculum. In other words, the point of the assignment was not to devise a full-blown lesson plan on this topic. Instead, I asked my students to think about three different ways of getting their students interested in the topic in the first place.
I plan to share some of the best of these ideas on this blog (after asking my students’ permission, of course).
This student submission again comes from my former student Diana Calderon. Her topic, from Algebra: adding, subtracting, and multiplying matrices.
How could you as a teacher creates an activity or project that involves your topic?
As a teacher I would do a foldable activity in which the students will have to fill in the blank in the front of the foldable that would allow them to discover how addition, multiplication and subtraction work for matrices. Once they open the foldable, they would have to do different examples and get to also create one. Out of the problems that the students create, as a teacher, I would choose one of each and allow them to go up to the board and explain how they did it and address any misconceptions that may have happened when they were discovering how the concepts work. I plan on doing my foldable with color coding so that the students can see where the numbers in the columns and rows changed when the matrices were added, multiplied, or subtracted, I will most likely limit the matrices to vary from 2×1,2×2,2×3,3×2,and 3×3.
How does this topic extend what your students should have learned in previous courses?
– The topic of adding, subtracting and multiplying matrices allows students to extend their knowledge when it comes to adding, multiplying or subtracting polynomials. I can show the students how a polynomial is similar to a 1×1 matrix. Another subject that they may see something similar to matrices would be in Biology with the punnett squares, it can be as basic as doing it for one generation or two and then go from there on. As said in the article “Use of Matrices to Determine Genetic Probability” by Andrew Almendarez, “Through prescribed manipulations and interpretations matrices can be used to represent and solve physical problems. One such problem is finding the probability of a certain genotype within a population over multiple generations.”, this also ties into probability which they most likely learned the previous year. It would be good to tell them that if they are interested in the medical lab field for example, “trying to breed cows that produce the most milk. If cows of a certain genotype were known to produce more milk than others it is useful to know how many cows of that genotype there will be after a number of generations, and what will maximize the proportion of that genotype in the future. This is where the Punnett is used in conjunction with matrices”.
How has this topic appeared in pop culture (movies, TV, music, video games, etc.)?
The topic of matrix multiplication came up when I looked in the news. Recently, apple has been one of the most popular brands when it comes to computers, cellular devices, TV, ear phones, etc. With that being said, every year or so they release a new “it” item. This month they are releasing the new iPhone 11, which overall in my opinion is the best cellular device one can get, it has a sleek professional design, great camera, a huge amount of storage embedded within itself and many other useful resources that one utilizes in their everyday life. In the article “iPhone 11: Apple’s A13 Bionic Chip Enables More Than Just Faster Speed” it mentions matrices and how “The A13 Bionic has a whopping 8.5 billion second-generation seven-nanometer transistors, up from 6.9 billion in the previous generation. It can perform one trillion operations per second, thanks in part to new machine learning accelerators that can run matrix multiplication six times faster.”. For me it is amazing to know just how fast these devices can calculate anything and everything one wants to find out instead of doing it by hand.
Citations:
• Use of Matrices to Determine Genetic Probability
https://www.academia.edu/20442574/Use_of_Matrices_to_Determine_Genetic_Probability
• iPhone 11: Apple’s A13 Bionic Chip Enables More Than Just Faster Speed
https://www.inverse.com/article/59239-a13-chip-faster-more-efficient
