Hat tip to http://www.thisiscolossal.com/2013/06/the-visual-patterns-of-audio-frequencies-seen-through-vibrating-sand/, where I first saw the video below and which posts some details about how this video was made.
Year: 2013
The “Don’t Suck” theory of improving graduation rates
From the Chronicle of Higher Education:
Maintaining an up-to-date list of available tutors, calculating financial aid accurately, placing students in the right classes, picking up garbage, and maintaining elevators aren’t “best” practices. They are “minimally competent” practices. Nobody is ever going to publish a research study finding a causal link between $125,000-per-photocopier contracts, Caribbean cruises, and graduation rates.
But I’m quite sure that these things are much more important to helping students graduate than the presence or absence of specific retention programs. They all go to the basic competence and quality of the institution. Well-run universities that have student-focused organizational cultures and are properly accountable to outside regulatory bodies simply don’t behave this way. Well-run universities are also much more successful in helping student earn degrees. It’s unreasonable to think that a university like Chicago State, which enrolls many part-time, low-income, and academically diverse students, will have a 100 percent graduation rate. But based on the research and examples cited in the article, it’s reasonable to expect that CSU could graduate 1 in 2 students, as opposed to 1 in 10.
Source: http://chronicle.com/blogs/brainstorm/the-dont-suck-theory-of-improving-graduation-rates/26483
A great algebra question. (Or is it?)
I absolutely love the following algebra question:
Mrs. Ortiz made a batch of cookies for Carlos, Maria, Tina, and Joe. The children shared the cookies equally and finished them all right away.
Then Mrs. Ortiz made another batch of cookies, twice as big as the first. When she took the cookies off the cookie sheet, 6 of them crumbled, so she didn’t serve them to the children. She gave the children the rest of the cookies.
Just then, Mr. Ortiz came home and ate 2 cookies from the children’s tray. Each of the children ate 3 more cookies along with a glass of milk. They were stuffed, so they decided to leave the last 4 cookies on the tray.
1. How many cookies were in the first batch?
2. How many cookies did each of the children eat?
The reason I love this algebra question is that it wasn’t an algebra question. It was a question that was posed to upper elementary students. (Here are the Google results for this question; most of the results are brain-teaser type questions for students ranging from 4th grade to 6th grade.)
As a math person, my first instinct probably would be to let 
So try to think about this problem from the perspective of a child who hasn’t learned algebra yet. How would you even start tackling a complex problem like this if you didn’t know you could introduce an
I encourage you to take a few minutes and try to solve this problem as a 4th or 5th grader might try to solve it.
While this problem doesn’t require the use of algebra, it does require the use of algebraic thinking. That’s what I love about this problem: even a 9-year-old child can be reasonably expected to think through a solution to this problem, even if the methods that they might choose may not be those chosen by students with more mathematical training.
My observation is that math majors in college — even those that have good teaching instincts and want to teach in high schools after graduating — have a difficult time thinking that far back in time. Of course, putting themselves in the place of students who have not learned algebra yet is a good exercise for anyone who wants to teach algebra. So that’s a major reason that I love this problem; it’s a good vehicle for forcing college students who are highly trained in mathematics to think once again like a pre-algebra student.
Cryptography As a Teaching Tool
From the webpage Cryptography As a Teaching Tool, found at http://www.math.washington.edu/~koblitz/crlogia.html, which was written by Dr. Neal Koblitz, Professor of Mathematics at the University of Washington:
Cryptography has a tremendous potential to enrich math education. In the first place, it puts mathematics in a dramatic setting. Children are fascinated by intrigue and adventure. More is at stake than a grade on a test: if you make a mistake, your agent will be betrayed.
In the second place, cryptography provides a natural way to get students to discover certain key mathematical concepts and techniques on their own. Too often math teachers present everything on a silver platter, thereby depriving the children of the joy of discovery. In contrast, if after many hours the youngsters finally develop a method to break a cryptosystem, then they will be more likely to appreciate the power and beauty of the mathematics that they have uncovered. Later I shall describe cryptosystems that the children can break if they rediscover such fundamental techniques of classical mathematics as the Euclidean algorithm and Gaussian elimination.
In the third place, a central theme in cryptography is what we do not know or cannot do. The security of a cryptosystem often rests on our inability to efficiently solve a problem in algebra, number theory, or combinatorics. Thus, cryptography provides a way to counterbalance the impression that students often have that with the right formula and a good computer any math problem can be quickly solved.
Mathematics is usually taught as if it were a closed book. Other areas of science are associated in children’s minds with excitement and mystery. Why did the dinosaurs die out? How big is the Universe? M. R. Fellows has observed that in mathematics as well, the frontiers of knowledge can and should be put within reach of young students.
Finally, cryptography provides an excellent opportunity for interdisciplinary projects… in the middle or even primary grades.
This webpage provides an excellent mathematical overview as well as some details about to engage students with the mathematics of cryptography.
Math T-shirts
The following are the three finalists for the T-shirt contest sponsored by the Mathematical Association of America.


 Source: https://www.facebook.com/media/set/?set=a.10151715596230419.1073741825.153302905418&type=1
Engaging students: Box and whisker plots
In my capstone class for future secondary math teachers, I ask my students to come up with ideas for engaging their students with different topics in the secondary mathematics curriculum. In other words, the point of the assignment was not to devise a full-blown lesson plan on this topic. Instead, I asked my students to think about three different ways of getting their students interested in the topic in the first place.
I plan to share some of the best of these ideas on this blog (after asking my students’ permission, of course).
This submission comes from my former student Jesse Faltys. Her topic: how to engage students when teaching box and whisker plots.
A. Applications – How could you as a teacher create an activity or project that involves your topic?
Students can take a roster of a professional basketball team and create a box and whiskers plot by using the players’ stats of height and weight. As the teacher, you can provide these numbers to them. The weight should be left in pounds, but change the height measurement to inches. The students could be placed in groups of 3 or 4 and given different team rosters. First, have the student calculate the minimum, maximum, lower quartile, upper quartile, and median for their roster for both the weight and height. Then, have the students place the plots on large sheets of paper and present to the class. As the students compare their plots, they can begin to see what effects the range of data has on the construction of each box and whisker plot. Depending on the knowledge of the students you might want them to all working on the same team. As the teacher, you can remove one player’s stats from each group effectively changing the box and whiskers plots and having the students analyzing the data’s effect on the plot constructed from the same roster.
I actually used this in a lesson during my Step II class in a middle school classroom. I used information from the Illuminations website at http://illuminations.nctm.org/LessonDetail.aspx?ID=L737.
B. Curriculum – How can this topic be used in your students’ future courses in mathematics or science?
Any science course with a lab will require you to complete a formal lab write-up. The data collected from your experiment will need to be represented in an organized manner. The features of a box-and-whiskers plot will allow you to gather all your information and make observations off the data that your group and the class as a whole collected. This information can be combined into one plot or the individual lab groups can be compared for any inconsistencies. A box-and-whisker plot can be useful for handling many data values. It shows only certain statistics rather than all the data. Five-number summary is another name for the visual representations of the box-and-whisker plot. The five-number summary consists of the median, the quartiles, and the smallest and greatest values in the distribution. Immediate visuals of a box-and-whisker plot are the center, the spread, and the overall range of distribution. This documentation will allow the student to make a formal analysis while putting together their formal lab write-up.
E. Technology – How can technology be used to effectively engage students with this topic?
1. Khan Academy provides a video titled “Reading Box-and-Whisker Plots” which shows an example of a collection of data on the age of trees. The instructor on the video goes through the representations of the different parts of the structure of the box and whiskers plot. For our listening learners, this reiterates to the student what the plot is summarizing. http://www.khanacademy.org/math/probability/descriptive-statistics/Box-and-whisker%20plots/v/reading-box-and-whisker-plots
2. Math Warehouse allows you to enter the data you are using and it will calculate the plot for you. After having the students work on their own plots, you can have them check their work for themselves. This will allow for immediate confirmation if the student is creating the graph correctly with the data provided. Also, this is allowing the visual learners to see what happens to the length of the box or whiskers when changes are made to the minimum, maximum or median. http://www.mathwarehouse.com/charts/box-and-whisker-plot-maker.php#boxwhiskergraph
3. The Brainingcamp is another website that allows for interaction between the different parts of the plot and the student. This website allows for the students to see a group of data and the matching box-and-whiskers plot. The student can then explore by manually changing different values and instantly seeing a change in the graph. This involvement can stimulate questions to direct the student to complete understanding of the subject. As a hands on learner, it allows the students to manipulate the plot immediately in different “what if” situations. http://www.brainingcamp.com/resources/math/box-plots/interactive.php
What’s the State of High School Education? Bad, but Not as Bad as You Think
Taken from the Change the Equation blog, http://changetheequation.org/blog/what%E2%80%99s-state-high-school-education-bad-not-bad-you-think
Have U.S. twelfth graders made any progress in math since the 1970s? The answer is no, if we’re to believe news stories about the National Assessment of Educational Progress (NAEP), which released the results of its long-term math and science tests yesterday. Yet those news stories don’t have it quite right.
It is true that, overall, 17 year olds’ scores barely budged from 1973 to 2012. They rose a scant two points. But things look a bit different when you break down the data by racial and ethnic group. Every group made gains: black students gained 18 points, Hispanic students gained 17 points, Asian students gained six points, and white students gained four points.
The reason for this apparent impossibility? Black and Hispanic students, who unfortunately lag behind their white peers, make up a much bigger share of the population now than they did in 1973. That brings down the total score. (Jack Jennings noted this dynamic several years ago.) Yet those who imply that our students are no better served by the K-12 system than they were 40 years ago are ignoring the evidence.
So should we be popping the champagne corks? Hardly. Progress in high school has been much slower than in elementary and middle schools, where student gains have amounted to several grade levels worth of learning. In fact, high schools seem to be undoing some of the gains made by elementary and middle schools.
But gloomy fatalism and blanket indictments of K-12 won’t do us much good. One lesson NAEP teaches us is that change is possible—we can move the needle when we set our minds to it. We’ve also got to step up our game. Students of color make up a growing share of our school enrollments. If we don’t accelerate the progress we have already made with them, we will pay a very high moral and economic price.
Binary sudoku
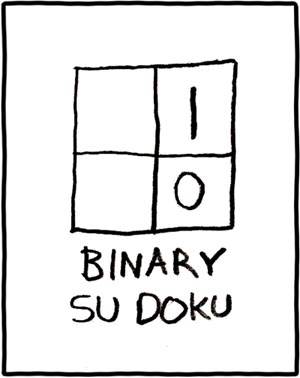
After a week of posts on Taylor series, I thought something on the lighter side would be appropriate.
Source: http://www.xkcd.com/74/
Reminding students about Taylor series (Part 6)
Sadly, at least at my university, Taylor series is the topic that is least retained by students years after taking Calculus II. They can remember the rules for integration and differentiation, but their command of Taylor series seems to slip through the cracks. In my opinion, the reason for this lack of retention is completely understandable from a student’s perspective: Taylor series is usually the last topic covered in a semester, and so students learn them quickly for the final and quickly forget about them as soon as the final is over.
Of course, when I need to use Taylor series in an advanced course but my students have completely forgotten this prerequisite knowledge, I have to get them up to speed as soon as possible. Here’s the sequence that I use to accomplish this task. Covering this sequence usually takes me about 30 minutes of class time.
I should emphasize that I present this sequence in an inquiry-based format: I ask leading questions of my students so that the answers of my students are driving the lecture. In other words, I don’t ask my students to simply take dictation. It’s a little hard to describe a question-and-answer format in a blog, but I’ll attempt to do this below.
In the previous posts, I described how I lead students to the definition of the Maclaurin series

which converges to 
Step 7. Let’s now turn to trigonometric functions, starting with 
What’s 

As before, we continue until we find a pattern. Next, 

Next, 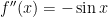

Next, 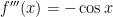

No pattern yet. Let’s keep going.
Next, 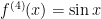

Next, 

Next, 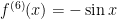

Next, 

OK, it looks like we have a pattern… albeit more awkward than the patterns for 

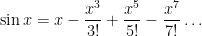
If we stare at the pattern of terms long enough, we can write this more succinctly as

The 


Let’s see… 
In Precalculus, a function 


A pedagogical note: In my opinion, it’s better (for review purposes) to avoid the 
Step 8. Let’s now turn try 
What’s 
Next, 

Next, 

It looks like the same pattern of numbers as above, except shifted by one derivative. Let’s keep going.
Next, 

Next, 

Next, 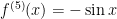

Next, 

OK, it looks like we have a pattern somewhat similar to that of $\sin x$, except only involving the even terms. I guess that shouldn’t be surprising since, from precalculus we know that 

Plugging into the series, we find that

If we stare at the pattern of terms long enough, we can write this more succinctly as

As we saw with 
For example, the series for 


using the periodicity of

Finally, using the cofunction identity 

In this way, the sine or cosine of any angle can be reduced to the sine or cosine of some angle between 

Step 10. For the final part of this review, let’s take a second look at the Taylor series
Just to be silly — for no apparent reason whatsoever, let’s replace 
![e^{ix} = \displaystyle 1 - \frac{x^2}{2!} + \frac{x^4}{4!} - \frac{x^6}{6!} \dots + i \left[\displaystyle x - \frac{x^3}{3!} + \frac{x^5}{5!} - \frac{x^7}{7!} \dots \right]](https://s0.wp.com/latex.php?latex=e%5E%7Bix%7D+%3D+%5Cdisplaystyle+1+-+%5Cfrac%7Bx%5E2%7D%7B2%21%7D+%2B+%5Cfrac%7Bx%5E4%7D%7B4%21%7D+-+%5Cfrac%7Bx%5E6%7D%7B6%21%7D+%5Cdots+%2B+i+%5Cleft%5B%5Cdisplaystyle+x+-+%5Cfrac%7Bx%5E3%7D%7B3%21%7D+%2B+%5Cfrac%7Bx%5E5%7D%7B5%21%7D+-+%5Cfrac%7Bx%5E7%7D%7B7%21%7D+%5Cdots+%5Cright%5D&bg=ffffff&fg=000000&s=0&c=20201002)
after separating the terms that do and don’t have an 
Hmmmm… looks familiar….
So it makes sense to define

which is called Euler’s formula, thus proving an unexpected connected between
Reminding students about Taylor series (Part 5)
Sadly, at least at my university, Taylor series is the topic that is least retained by students years after taking Calculus II. They can remember the rules for integration and differentiation, but their command of Taylor series seems to slip through the cracks. In my opinion, the reason for this lack of retention is completely understandable from a student’s perspective: Taylor series is usually the last topic covered in a semester, and so students learn them quickly for the final and quickly forget about them as soon as the final is over.
Of course, when I need to use Taylor series in an advanced course but my students have completely forgotten this prerequisite knowledge, I have to get them up to speed as soon as possible. Here’s the sequence that I use to accomplish this task. Covering this sequence usually takes me about 30 minutes of class time.
I should emphasize that I present this sequence in an inquiry-based format: I ask leading questions of my students so that the answers of my students are driving the lecture. In other words, I don’t ask my students to simply take dictation. It’s a little hard to describe a question-and-answer format in a blog, but I’ll attempt to do this below.
In the previous posts, I described how I lead students to the definition of the Maclaurin series
which converges to
Step 5. That was easy; let’s try another one. Now let’s try 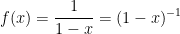
What’s 
Next, to find 

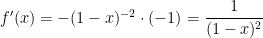
Next, we differentiate again: 

Hmmm… no obvious pattern yet… so let’s keep going.
For the next term, 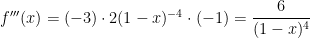

For the next term, 

Oohh… it’s the factorials again! It looks like 
Plugging into the series, we find that

Like the series for 

The right-hand side is a special kind of series typically discussed in precalculus. (Students often pause at this point, because most of them have forgotten this too.) It is an infinite geometric series whose first term is $1$ and common ratio $x$. So starting from the right-hand side, one can obtain the left-hand side using the formula

by letting 
In other words, in precalculus, we start with the geometric series and end with the function. With Taylor series, we start with the function and end with the series.
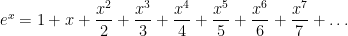
Step 6. A whole bunch of other Taylor series can be quickly obtained from the one for

and

we have

____________________
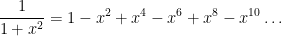
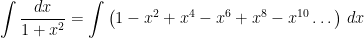
Next, let’s replace 

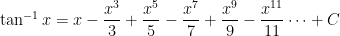
Now let’s take the indefinite integral of both sides:


To solve for the constant of integration, let 

Plugging back in, we conclude that

The Taylor series expansion for 

Subtracting, we find

My understanding is that this latter series is used by calculators when computing logarithms.
____________________
Next, let’s replace 
Now let’s take the indefinite integral of both sides:
To solve for the constant of integration, let

Plugging back in, we conclude that

____________________
In summary, a whole bunch of Taylor series can be extracted quite quickly by differentiating and integrating from a simple infinite geometric series. I’m a firm believer in minimizing the number of formulas that I should memorize. Any time I personally need any of the above series, I’ll quickly use the above steps to derive them from that of
